Blog

Inside the world of Twenty3 Smart Graphics

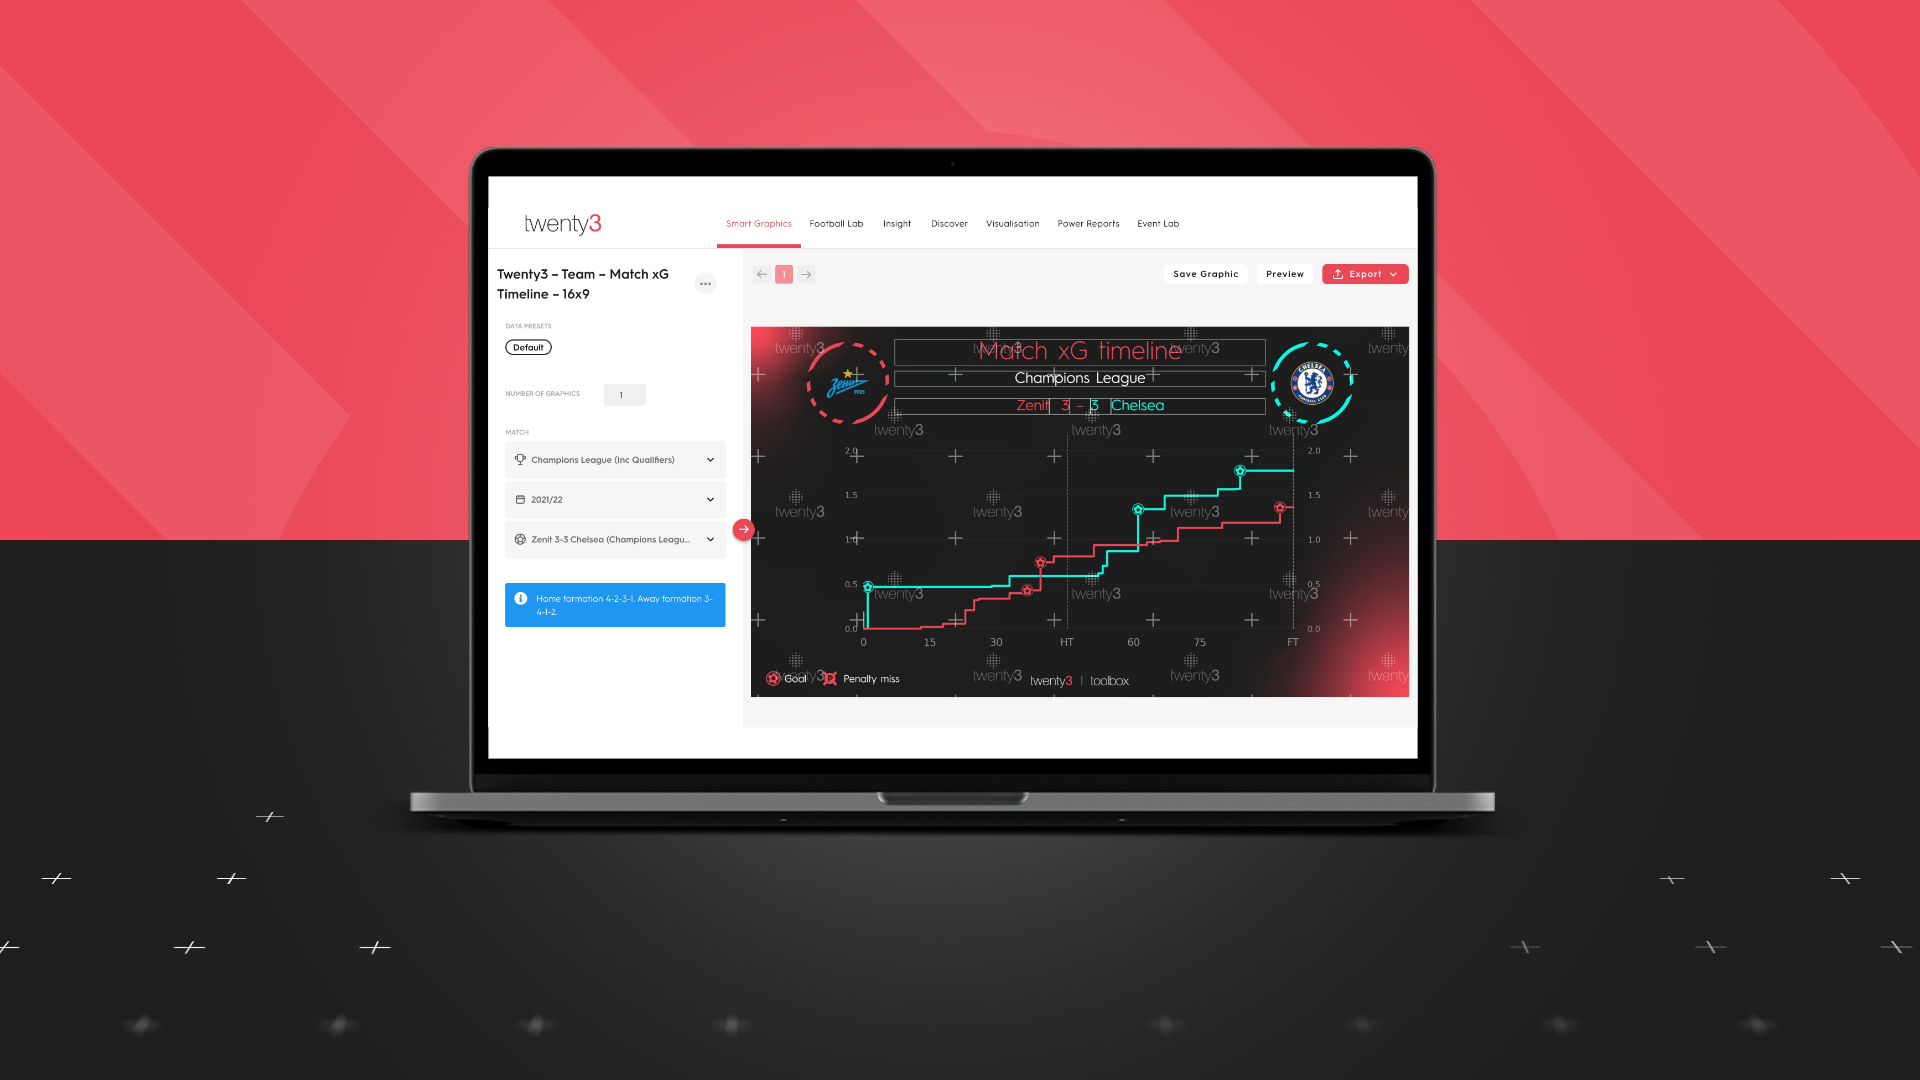
In Portuguese In a world of AI assistants, roombas and cars that park themselves, why manually make your own graphics? The machines can do the turgid manual labour there as well. Twenty3’s Smart Graphics connect branded templates and assets to data, a suite of data visualisations and your own image library. Sounds useful. Sounds smart.…

Read More

The 4 key football metrics to know about in 2022

Remember the time when it seemed weird for statistics — ones which weren’t goals or shots or corners — to be used in football coverage? And now expected goals are almost the norm. This year, 2022, will be no different, and there might be even more stats entering our collective consciousness. Last year we looked…

Read More

People like patterns: Introducing our xG timelines

It’s not often that school science experiments stick with you, or end up relating to football data, but this one clearly had an impact.  We, as a class, were faced with a series of numbers like this: 6 2 8 1 0 2 9 3 1 0 2 2 6 1. If you try and…

Read More

Custom Metrics in the Event Lab: Leeds United, PPDA and Game State

It’s always a good thing, from time to time, to check that your perceptions are backed up by something meaningful. Marcelo Bielsa’s Leeds United are a team whose reputation precedes them by a Yorkshire mile (like a Lancashire mile, but better), particularly the intensity and relentlessness of their pressing. However, just how intense is it…

Read More

Analysis: How Brentford broke the chain of Arsenal’s short goal kicks

Brentford’s reputation seems to have preceded them.  Last season, Arsenal — the Bees’ opponents on opening day — kept 42 per cent of their goal kicks at a short or medium length, ending less than 40 metres from goal. That rate was about average for the league as a whole, but, against some teams, they…

Read More

Analysing Rúben Neves’ penchant for long shots with the Event Lab

Rúben Neves likes a shot from range. If you’re unfamiliar with the Wolves midfielder, his shot map tells you just how fond of them he is. It’s as if the penalty area is a high-end nightclub and his shots keep turning up in trainers, left waiting outside the place everyone wants to be in. But…

Read More

Scouting at Euro 2020: Embrace data, but use it wisely

The Copernican revolution was when European society accepted Nicolaus Copernicas’ wisdom that the Sun did not revolve around the Earth. The Kuperian revolution was when footballing society accepted Simon Kuper and Stefan Szymanski’s wisdom that transfer policy should not revolve around major tournaments. In their book Soccernomics, Kuper and Szymanski noted that “the worst time…

Read More

The evolution of football data

When Charles Darwin first wrote about evolution, he wrote about the beaks of finches. They had evolved to do different tasks to find food, some to root around finding insects and some to break open nuts. The ideas of evolution and natural adaptation were set in full motion, that different beings will adapt to new…

Read More

Treat data like using a map – it can help everyone

I’ve written before about how learning to apply football data is like learning a foreign language. You learn the definitions of words, but the way you put those words together is kind of up to you. It can be artful. However, that thought might be a little daunting, so let me offer an alternative metaphor.…

Read More

Introducing a new Twenty3 visualisation: Defensive solidity

Football matches are sometimes described like boxing bouts, as two fighters punching and counter-punching, slugging it out in an attempt to fell their opponent. It’s a dramatic comparison, sure, but it hits at a fundamental truth. As in boxing, in football you attack by taking action and you largely defend in ways which don’t make…

Read More