
Introducing a new Twenty3 visualisation: Defensive solidity

Football matches are sometimes described like boxing bouts, as two fighters punching and counter-punching, slugging it out in an attempt to fell their opponent. It’s a dramatic comparison, sure, but it hits at a fundamental truth.
As in boxing, in football you attack by taking action and you largely defend in ways which don’t make contact with the opposition. In the ring you evade punches; on the pitch you create a compact defensive shape. It’s for this reason that passing in football takes on a U-shape, and why looking at the defensive actions (like tackles, interceptions) can give an incomplete picture of a team’s defending.
In the Twenty3 Toolbox, we’ve recently introduced a visualisation we’re calling a ‘defensive solidity’ map. The pitch is split into zones, and we look at how easily opponents find it to pass towards goal from there. The more solid the team is in that zone, the brighter the colour.
Wolves are a nice example whose defensive approach shines through clearly. Once the opposition crosses the halfway line, Wolves become much more solid, much harder to pass through towards goal. Before opponents get to the halfway line — when they’re building out from the back — it’s much easier for them to move towards goal.

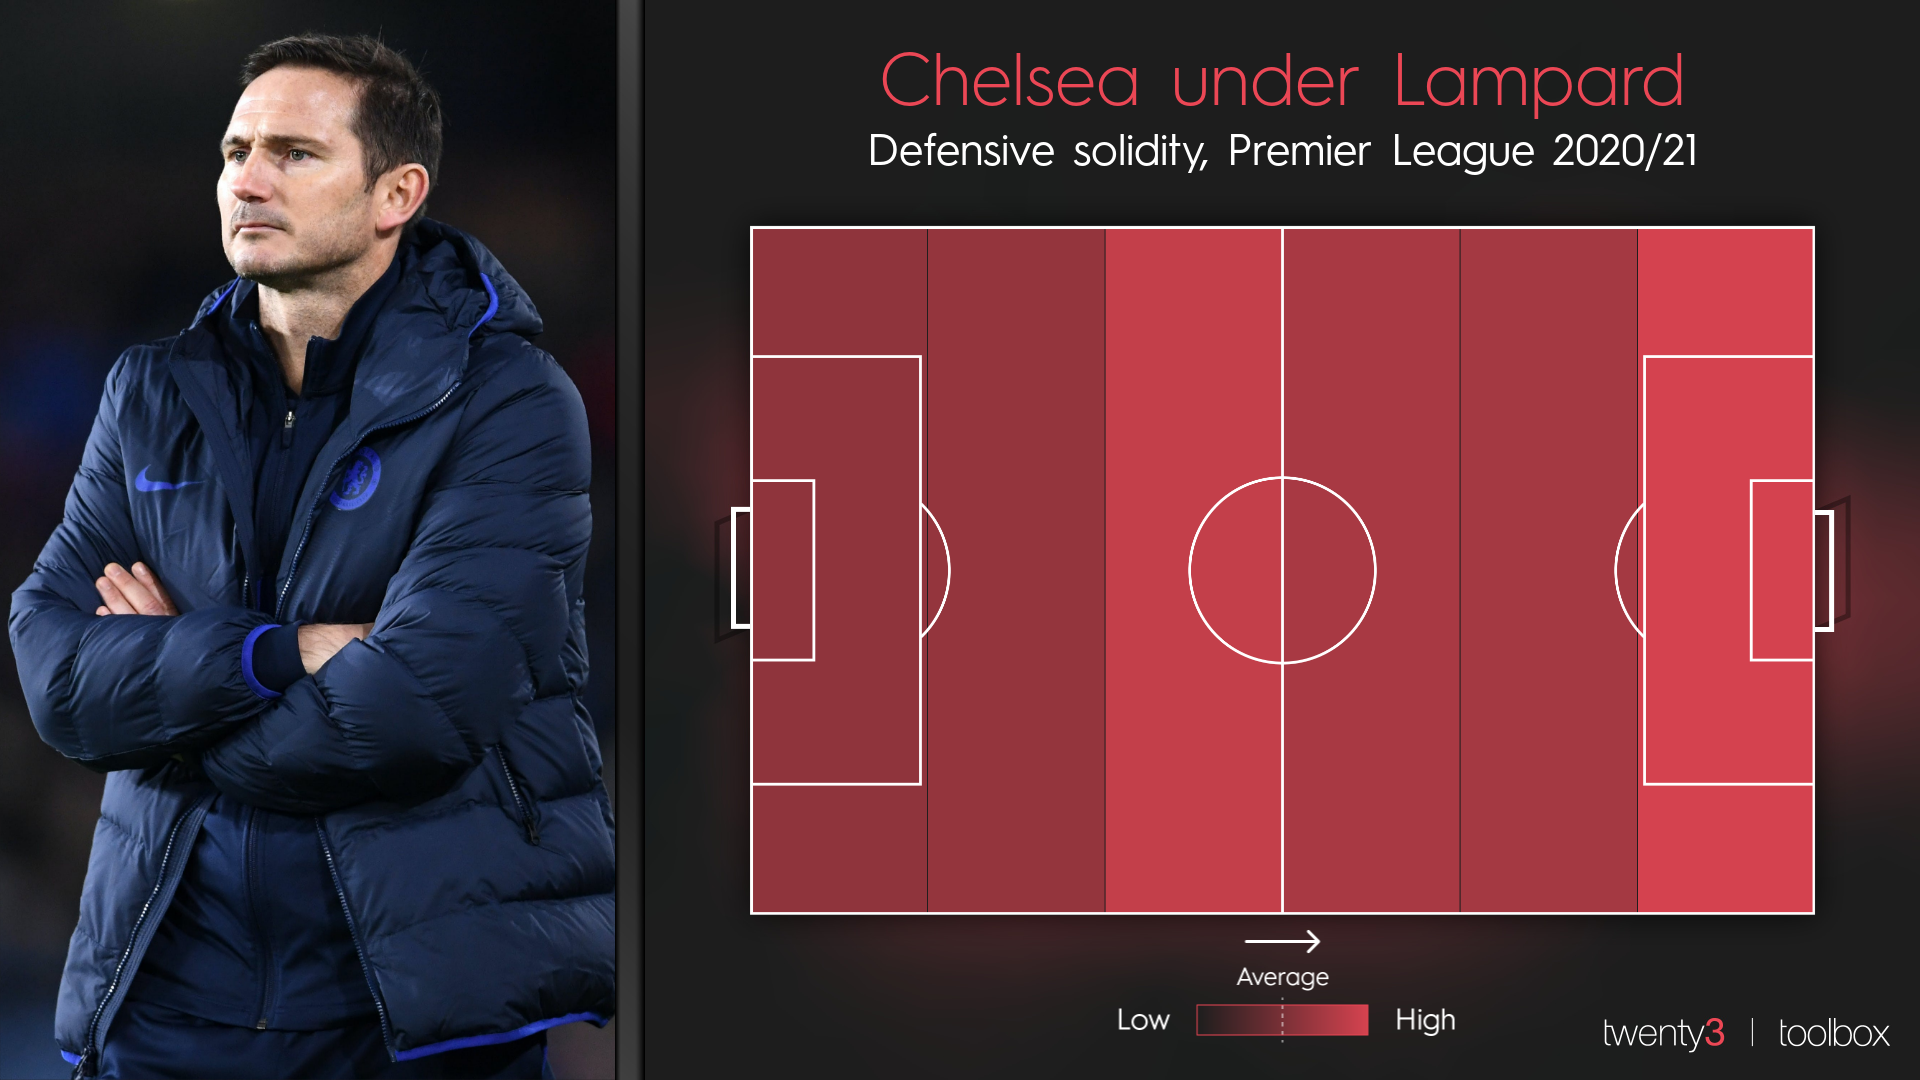
The calculation for each zone is the percentage of passes attempted from there which both went towards goal and were successfully completed. It’s simple, but the insights that you find can be incredibly illuminating, encapsulated beautifully by Chelsea men’s team across their change of managers this season.
Under Frank Lampard, the Blues were most difficult to get through at the furthest extremity of both halves: just inside their own half, and right up in areas where they’d be pressing the goalkeeper. Everywhere else, Chelsea were closer to average.
There’s been a marked change since Thomas Tuchel has taken over. The emphasis on pressing all the way up the field looks to have gone; instead they’ve dropped back a little and become supremely good at stopping teams advancing from just outside the opposition’s box.
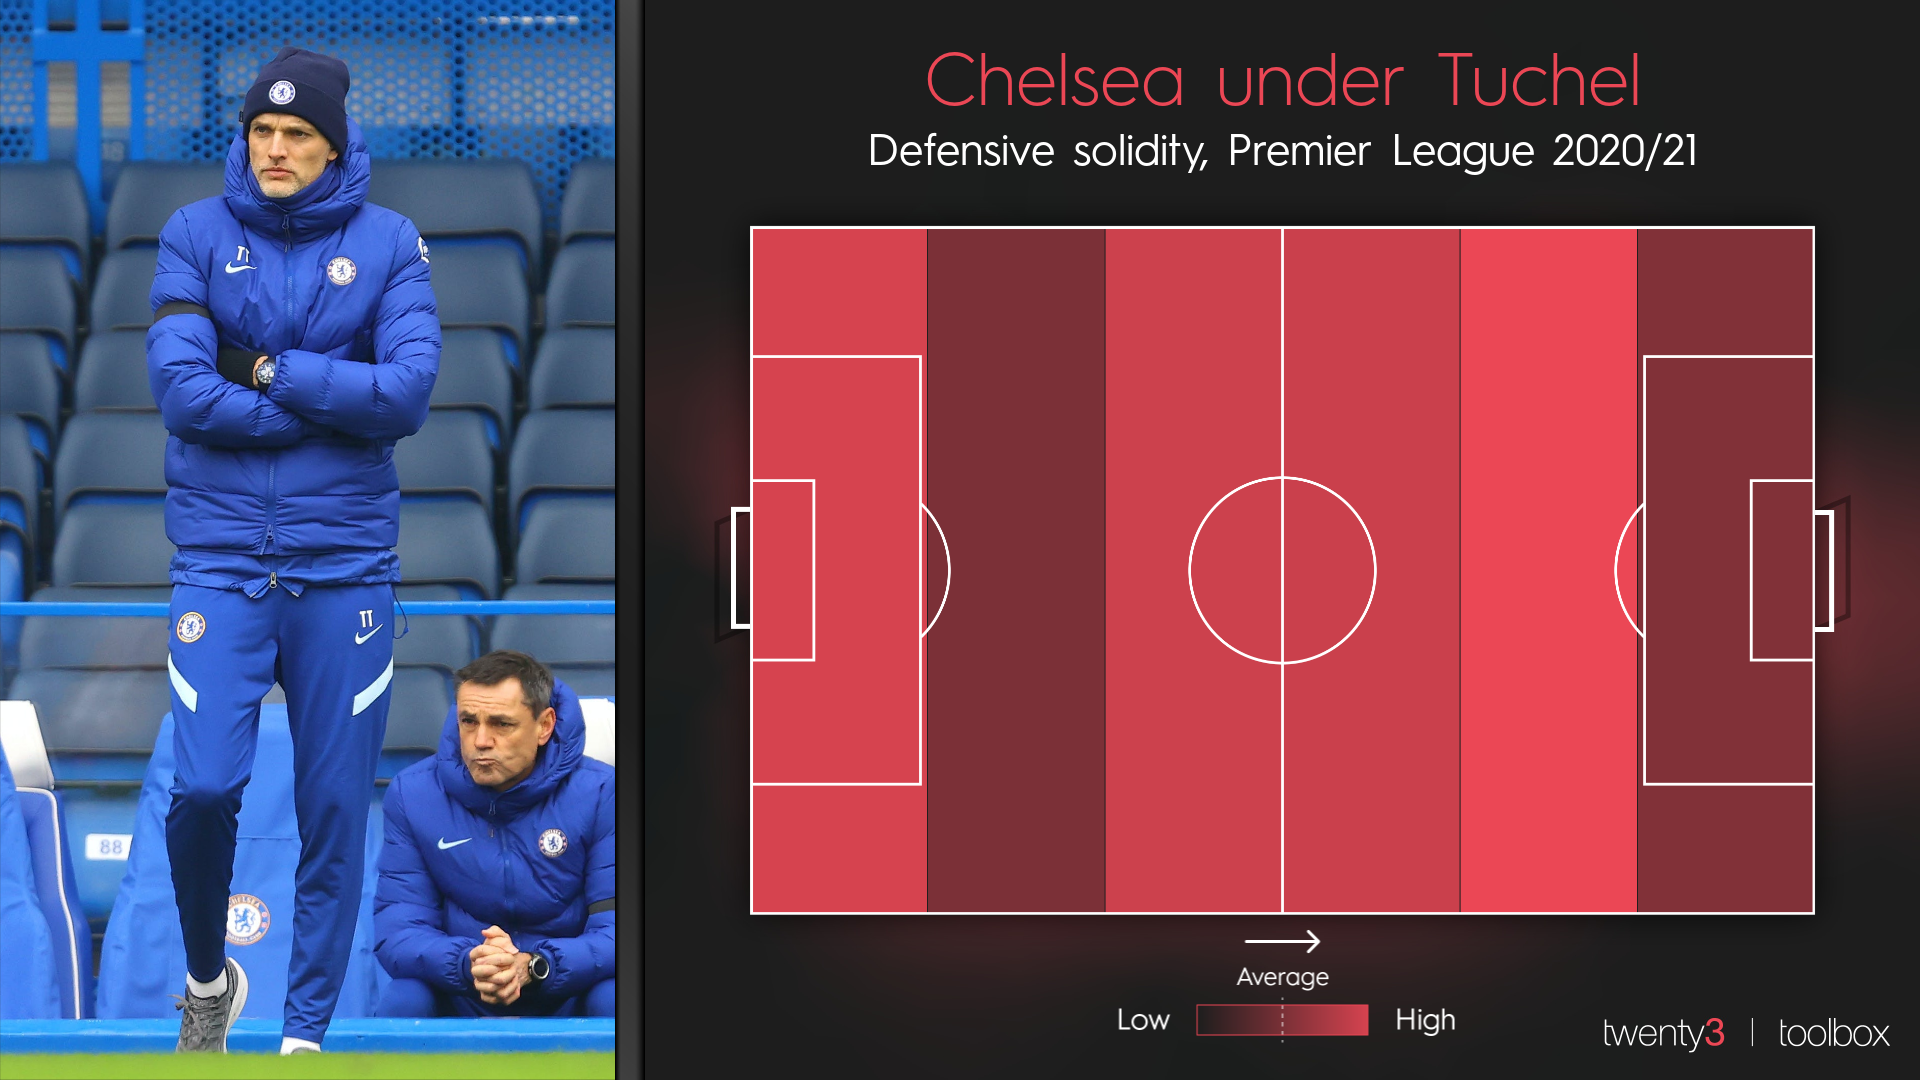
You’ll also notice that the zone just outside their own penalty area appears to have become less solid, while their very deepest zone has become more solid.
This seems to be a relatively common pattern amongst teams who apply pressure high up the field. Tuchel’s Chelsea mostly keep their opponents far from goal, keeping them from getting to that ‘second sixth’ zone of the pitch. It seems possible that they’re so effective at keeping their opponents away from goal that the rare occasions opponents do get to the second sixth it’s on a breakaway, and therefore easier to progress through. Good thing for Chelsea then that they’re so solid in the most defensive sixth of the pitch.
These don’t have to be visualised as sixths, working for multiple numbers of zones. The below example using the traditional thirds helps to dispel the lingering myth that Burnley are purely a deep block team. They’re hardest to get through, compared to the average in that zone, when defending high up the pitch.

In a way, these defensive solidity maps are just a small step. If the concept seems simple, that’s because it is. Despite this though, and despite being on the defensive side of things, they do pack quite a punch.
All the graphics and visualisations in this article use Wyscout data and were produced in the Twenty3 Toolbox.
If you’d like to request a Toolbox demo for your organisation, you can do so here.