
Gerard Moore uses the Event Lab to analyse centre-backs for recruitment

Not long ago we caught up with experienced Performance Analyst and former Head of Analysis at West Bromwich Albion, Gerard Moore, to find out what life is like as a professional analyst. You can read that interview here.
This time around, we gave Gerard the keys to our Event Lab tool to put his analysis skills to the test and find some centre-back recruitment targets for a fictitious Premier League club. Gerard offers a great level of insight into his workflow and how he uses data. Enjoy!
If you like what you see and want a piece of the Event Lab, don’t hesitate to scroll back up and click here to request a demo.
By Gerard Moore
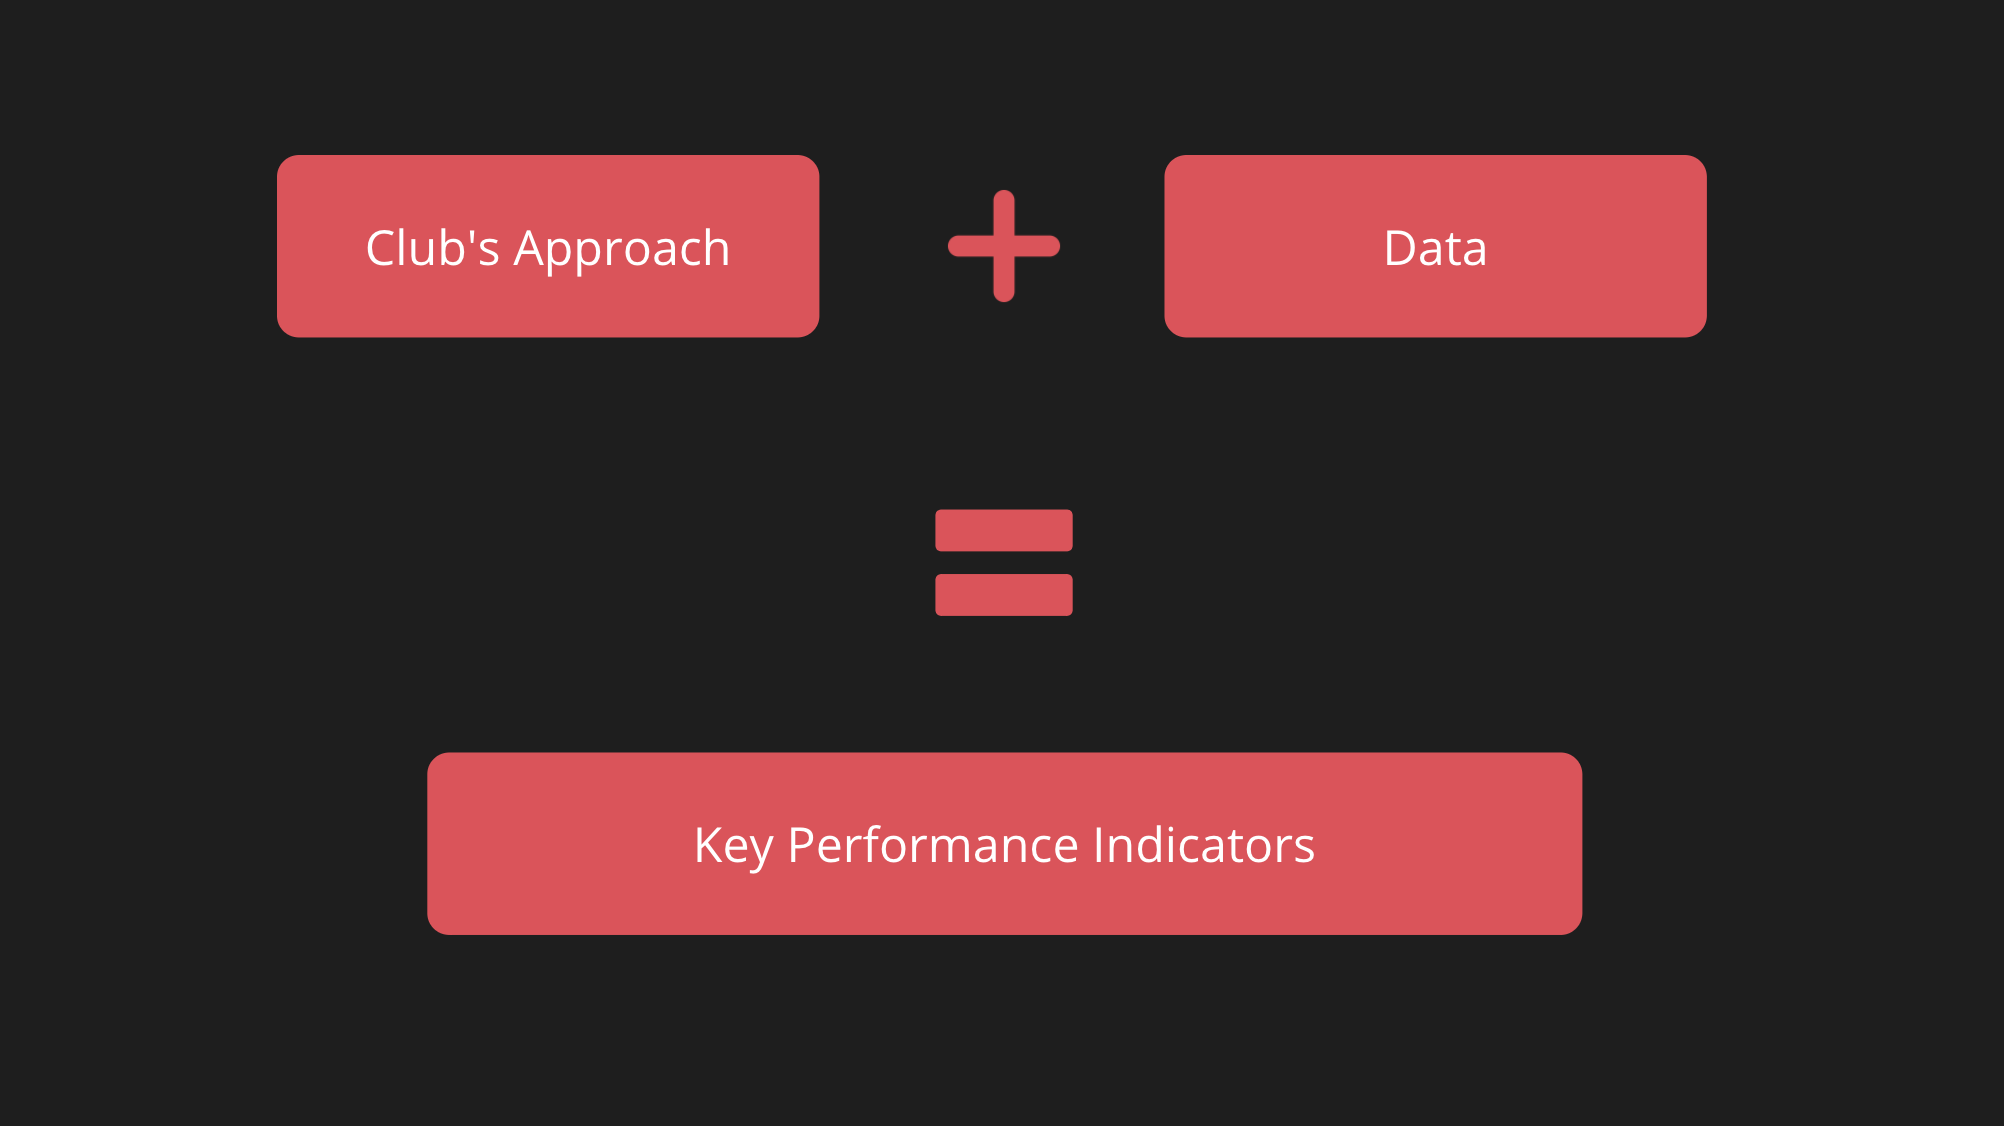
When building or adapting your processes it’s always vital that you incorporate the philosophy of the club and its approach to playing.
Understanding how your club wants to move forward and how it wants to approach matches will allow you to know what is expected of the team and of each position and individual in the squad. This will help build your Key Performance Indicators when analysing performances for recruitment.
It’s imperative that you know what you want but also what is available in the market. This will include prioritising what is most important to you in a player.
For this case study, I will be searching for a central defender for a fictitious Premier League team.
When looking at players, I will prioritise defensive capabilities over on-ball or attacking data.
For defensive analysis, I will focus on success rates, and for on-the-ball analysis, we will be looking at data for a progressive ball player. Furthermore, the club is looking to sign a young-to-mid 20s player rather than one who is in the latter stages of their career.
Utilising success rates to analyse defenders
With data mainly focused towards on ball events, it can be difficult to analyse defenders. This is because defensive moments won’t be dictated by the team but by their opponents.
We see some of the best defenders in the world playing for the top teams, but if you solely look at total statistics for their defensive actions, they are regularly lower down on lists.
For example, when taking a look at Defensive Actions Attempted, Rúben Dias ranks 58th and Virgil van Dijk ranks 123rd in the Premier League. Dayot Upamecano is 22nd in Bundesliga, Kalidou Koulibaly and Leonardo Bonucci come 78th and 95th respectively in Serie A, and Sevilla’s highly-rated Jules Koundé ranks 110th in La Liga.
One way of viewing this differently is utilising success rates in moments when duels take place. These duels can occur on the ground, aerially or for loose balls. The success players have in these moments will show how strong they are defensively when in individual battles.
This draws us to the common saying within football: “you need to win your individual battles”.
The advantage of % data
The use of % rates are a great way of comparing samples with a different number of observations.
It is unlikely you’ll find players within data sets with the same instances so using % data to compare success rates allows us to analyse these players better.
Using Twenty3’s Event Lab, we can build our own custom metrics – these are metrics that are relevant to us. For this study, I’ve created the following success rates:
Defensive Actions
- The % of successful defensive actions which includes defensive duels, interceptions and sliding tackles.
Ground Duels
- The % of success when a player attempts to stop an opposition player from progressing with the ball. This includes winning possession, kicking the ball out of play or forcing the attack backwards.
Aerial Duels
- The % of success when jumping against an opponent to touch the ball first.
Loose Ball Duels
- The % of success when winning possession when competing with the opponent when no team has clear ball possession.
It’s always important to understand the context of data and Aerial Duels are a good example of this. These aren’t divided into attacking or defensive categories, therefore, using the filtering tool, I have adjusted this stat to only take into account Aerial Duels that occur in the player’s own half. That way, they are focused on defensive actions with the exception of a rare event.
Using this data I will look at the top 5 European leagues. This highlights players most likely to pass the GBE points system.
This is always important to take into account and each player and league will offer different challenges and circumstances to bring in players.
Utilising the Event Lab, we will filter the list by position to only include central defenders.
I will only use data from this season to limit the data to be skewed over a number of seasons for other factors.
Results from the Event Lab
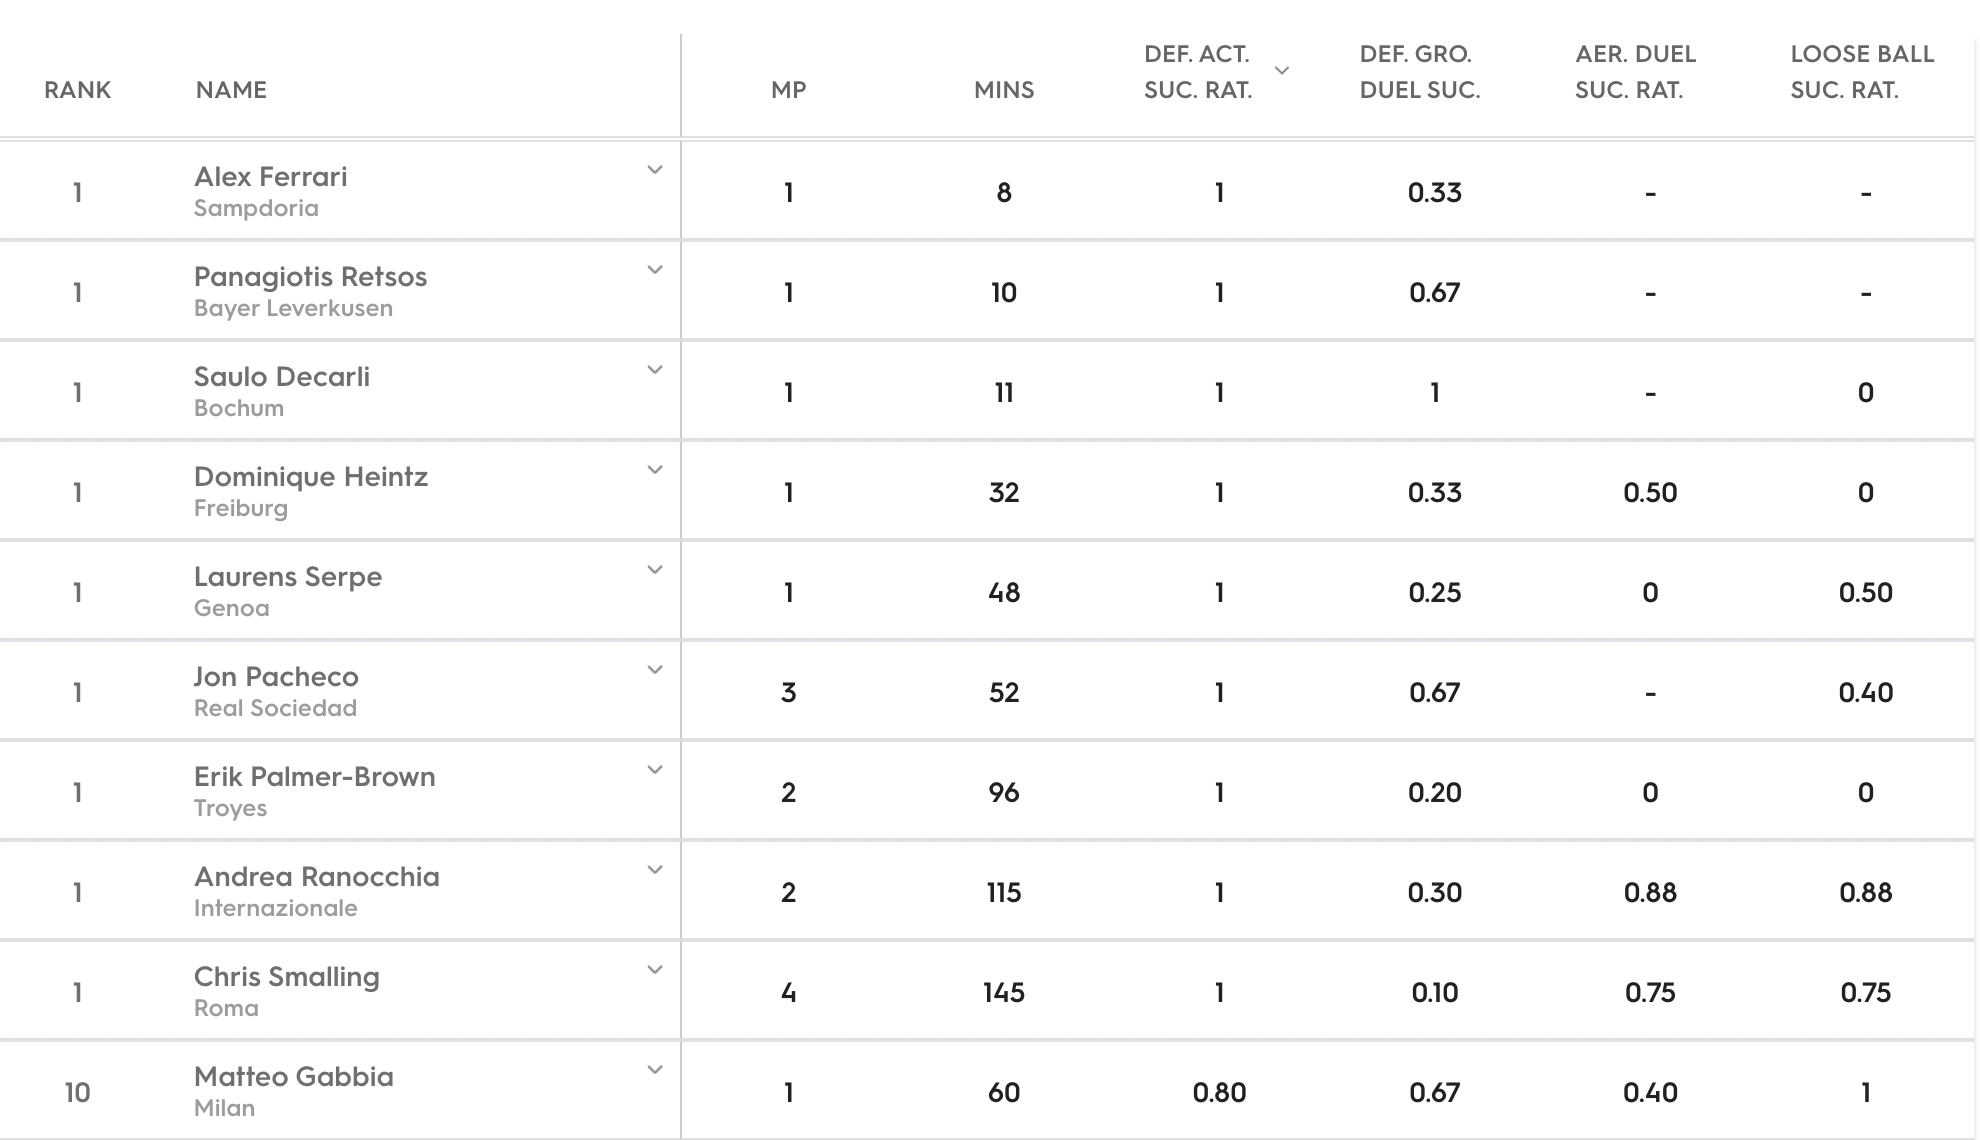
This is the first set of results from the Event Lab; as an analyst it is up to you how far you delve into the data and how far down the list you go. Here I have focused on the top 10.
From this first export, which produced 422 centre backs, it’s important to keep working on the data to find what you are looking for.
Therefore, we will further filter the data down through age and minutes played this season.
We’ll start with age as it’s in line with our fictitious club’s approach – so we’re filtering out players above the age of 26. We will also filter players who have low playing minutes to give us a better data sample for the players. The minimum will be 495 minutes played – this is based on the minimum 50% of available minutes played so far across the top 5 leagues.
This is the data now filtered to include players under the age of 26 and those who have played on or above 50% of minutes for their team in the top 5 leagues.
Analysing the data
We now look at the data and focus on different aspects. Simply sorting by certain KPIs can alter the order and bring up potential targets. In the first table, we’ve ranked the candidates by Defensive Action Success Rate whilst in the second table we focus on Defensive Ground Duel Success Rate. We then move on to Aerial Duels and Loose Ball Duels.


The above carousel includes rankings from left to right: Defensive Action Success Rate, Defensive Ground Duel Success Rate, Aerial Duel Success Rate, Loose Ball Duel Success Rate
We can now see the top 10 ranking for each of these four filters. Some players are high in one KPI but not in others. The Aerial Duel Success Rate brings up obvious examples of this with players displaying low Defensive Ground Duel Success Rates. Therefore, to further refine my targets, I will set a minimum of 0.25 for each of the four KPIs to produce an export that provides more balanced players across the board.


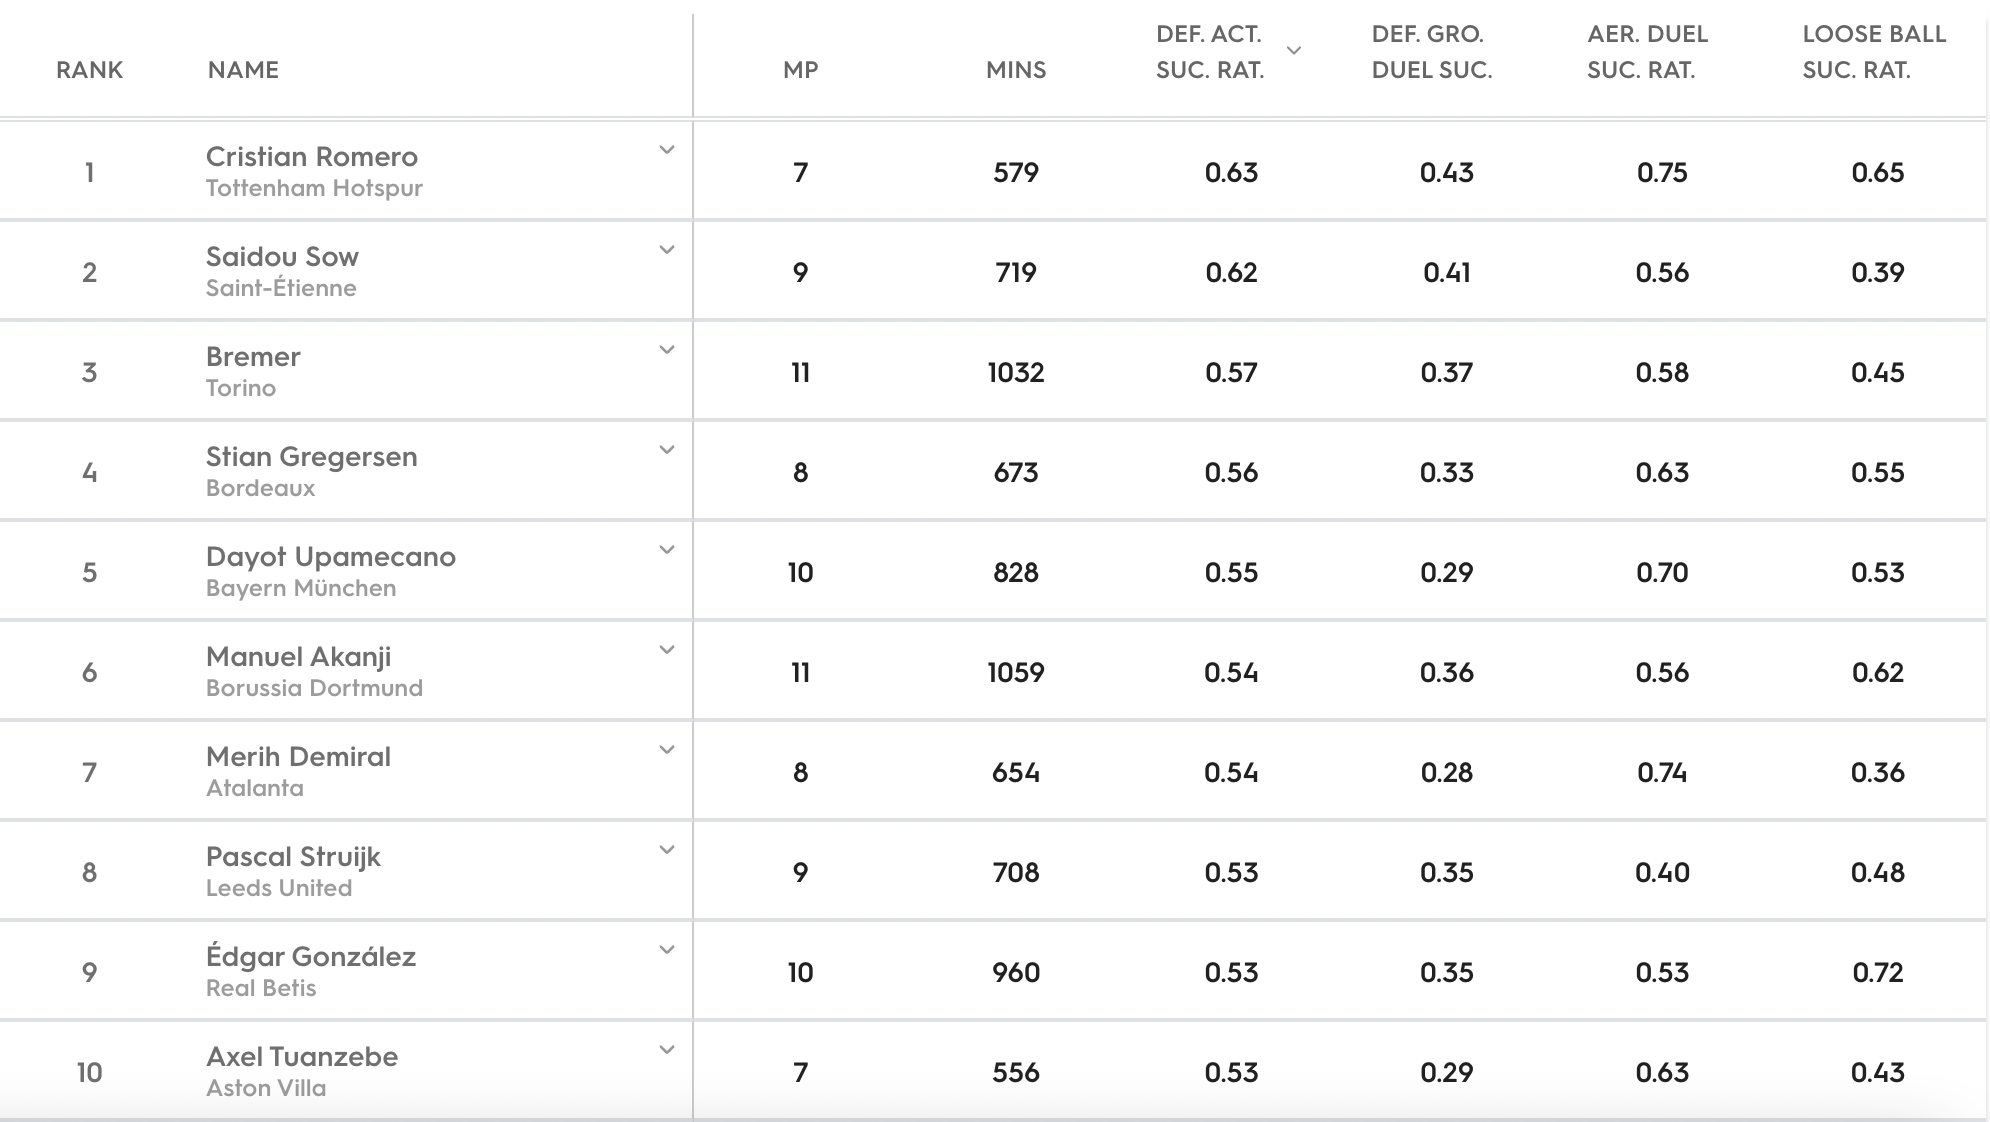
Scroll through the above carousel to see the updated rankings for each metric
Looking at the data now, the first thing that stands out is that only six players appear in the top 10 of two of the KPIs but no one appears in three or more.
When looking for consistency across all four KPIs, only seven players achieve equal or above 0.4 in each metric: Cristiano Romero, Mohammed Salisu, Robin Le Normand, Moussa Niakhaté, José María Giménez, Reece Oxford and Ben White. This paints a clear picture of how difficult it is to rank highly in each KPI.
Furthermore, it’s important to understand what you filter out when changing the metrics as Mainz 05’s Jeremiah St. Juste achieves equal or above 0.5 on all four KPIs. However due to injury this season, his minutes are low and he missed the 495-minute threshold.
Tottenham’s loan signing, Romero, is at the top of the Defensive Action Success Rate along with Saint-Étienne’s Saïdou Sow and Torino’s Bremer. Romero continues to rank highly in Defensive Ground Duel Success Rate but it is Arsenal rival White who comes out on top in Defensive Ground Duel Success Rate.
In Aerial Success, Matt Miazga, Giménez and Sinaly Diomandé lead the way. While Erhan Mašović stands out when we assess the Success Rate in Loose Ball Duels. Interestingly, these KPIs produce higher results in comparison to the other two.
Now, as an analyst you may want to filter down certain areas more tightly, for example, you may specifically want a defender who is particularly strong in the air. So you could filter the Aerial Duel Success to a higher rate but as we have focused on the top 10 of each KPI, this has cut down our original list of 422 central defenders across 5 leagues to 32 players.
Next, we will rule out what we deem to be unrealistic targets…
Filtering out unrealistic targets
Going through the list I can delve deeper into each player’s background.
To research their background, I look at key areas such as their contract status at their current club, injury record and their match availability and selection. From that data we can further filter down unrealistic targets.
Using data from Transfermarkt, I have cut down the list to exclude players whose contracts go beyond 2023 or that have any possible further options. This gives us targets who are more likely to be available to sign in the near future. We will take into account injuries and make judgements if we believe they have a poor injury record.
The results from this give us a list of 14 players:
Manuel Akanji (Borussia Dortmund), Ronald Araújo (Barcelona), Bremer (Torino), Andreas Christensen (Chelsea), Édgar González (Real Betis), Erhan Mašovic (VfL Bochum), Matt Miazga (Alavés, on loan from Chelsea), Moussa Niakhaté (Mainz 05), Amos Pieper (Arminia Bielefeld), Nico Schlotterbeck (SC Freiburg), Niklas Stark (Hertha Berlin), Niklas Süle (Bayern Munich), Axel Tuanzebe (Aston Villa, on loan from Manchester United) and Dani Vivian (Athletic Club).
Next, we will look at their match availability and selection.
Match availability
The use of match availability and 90-minute competition data
I believe in the near future, physical data will become more widely available across different leagues, giving us greater insight into a player’s physical capabilities over a match, a season and in different competitions.
However, one simple way to currently analyse a player’s physical levels using event data is to look at match availability and the number of matches completed. It’s important to understand how often a player can complete a full 90 minutes.
Knowing how often a player is available, when he’s selected, and how many minutes he plays will allow us to understand what he is capable of in terms of fixture schedule but it could also uncover unknown injuries.
This would always be further supported by what we see when video and live scouting players as we can then build a physical profile from our viewings.
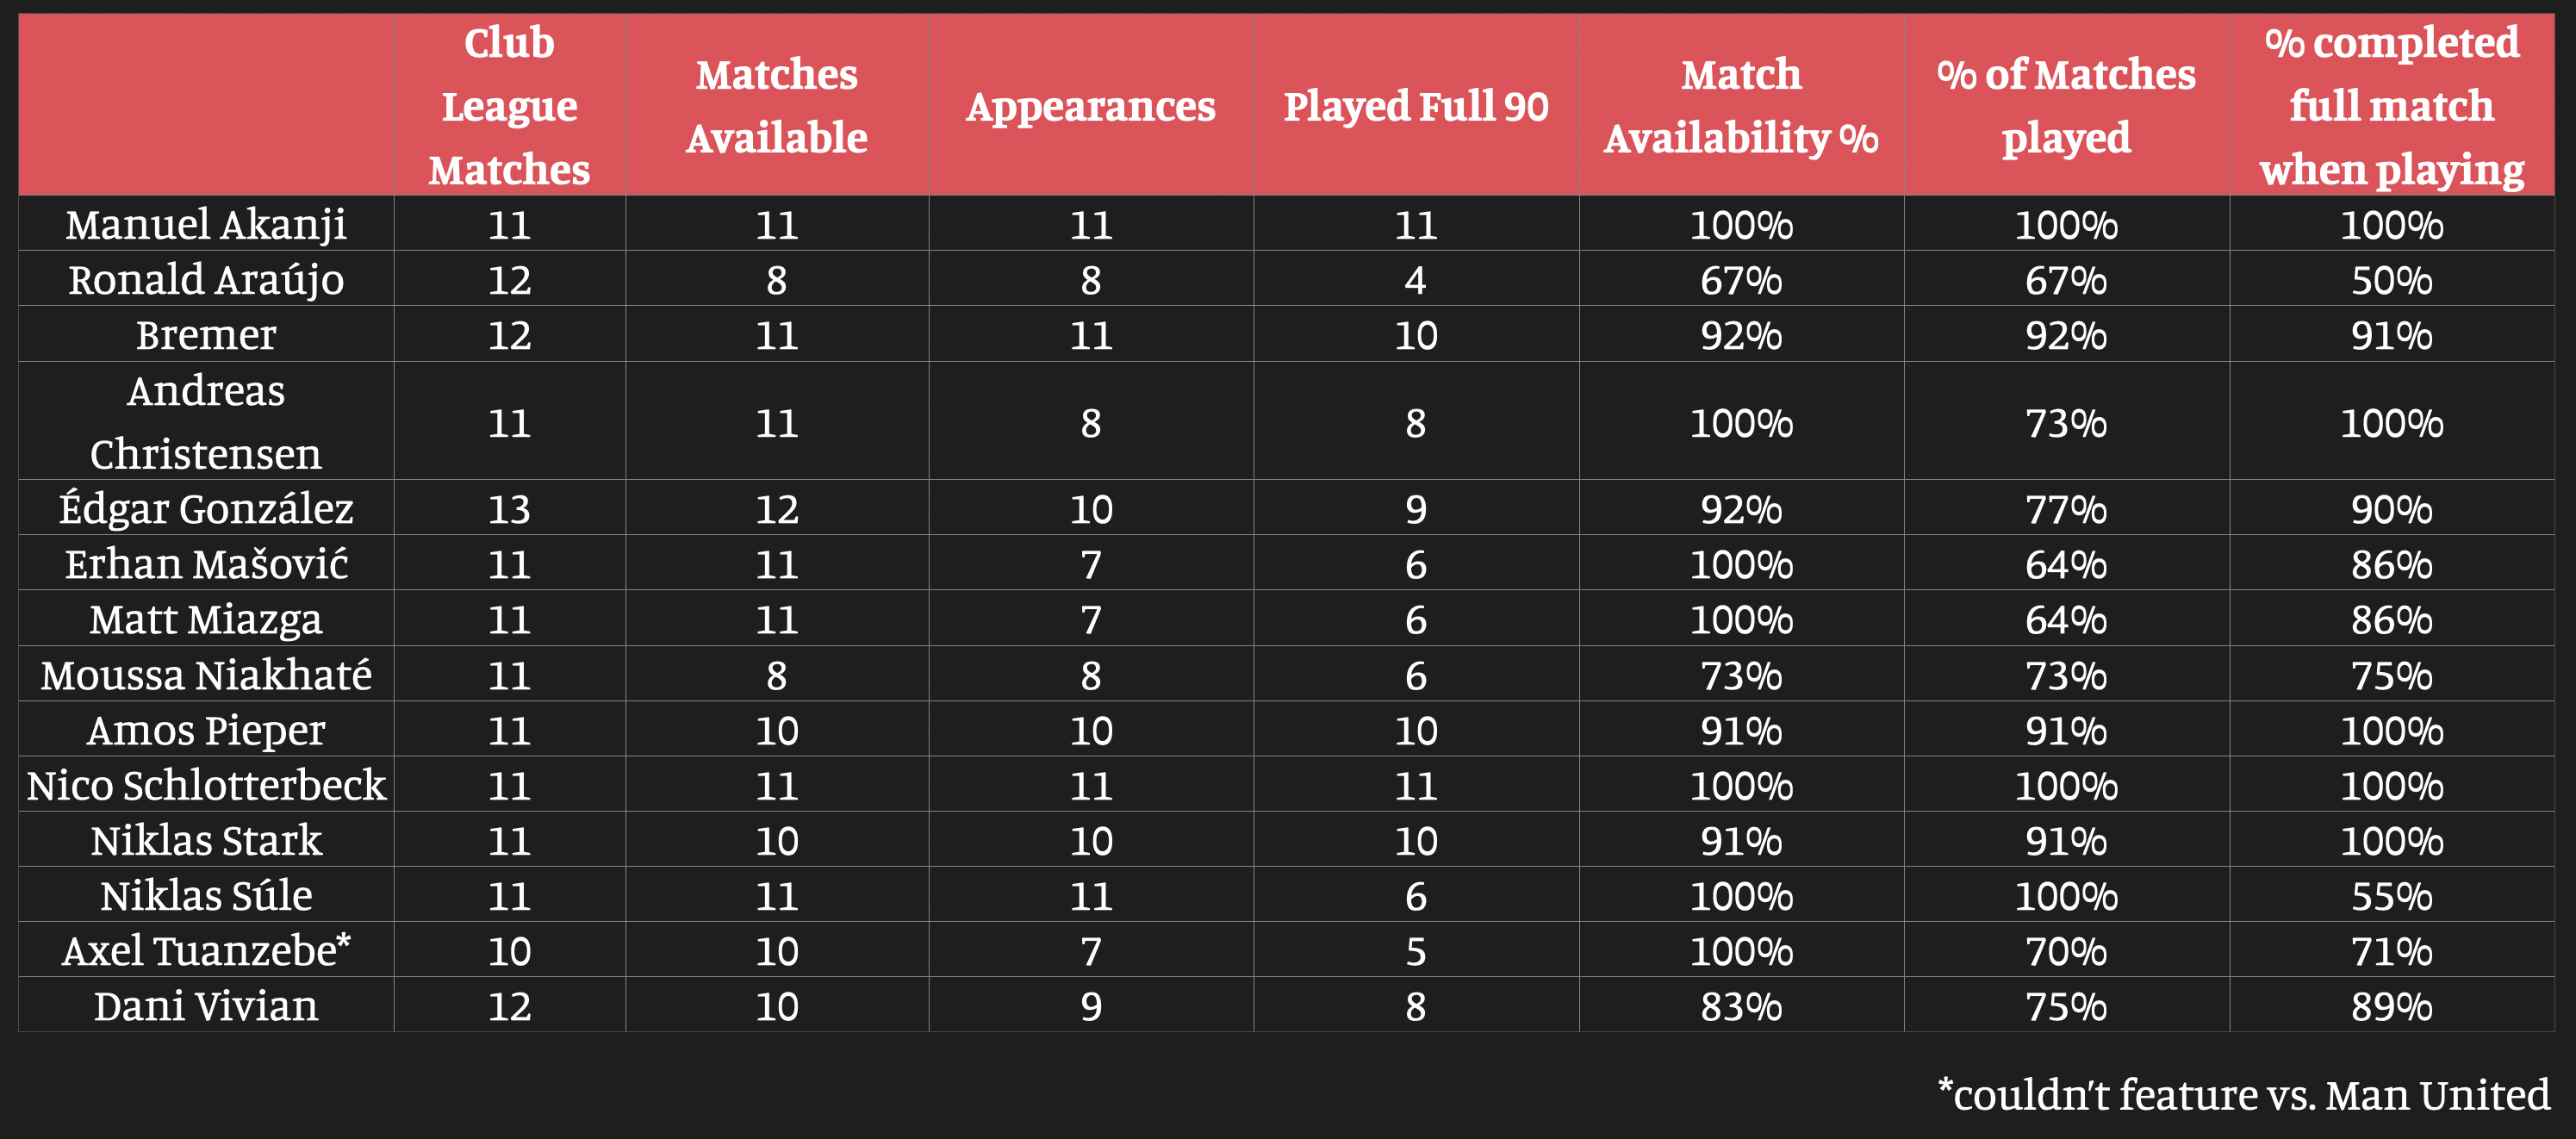
Below is my filtered list to rule out unrealistic targets.
Looking at the league matches only, this table shows their match availability, appearances made and the number of times they’ve played the full 90 minutes.
We can see the majority have good match availability, which is expected due to the minimum minutes played threshold we set earlier, with the two exceptions being Araújo and Niakhaté. We see that seven players on our list have been available for 100% of the league matches but furthermore, we can see that Akanji, Christensen, Pieper, Schlotterbeck and Stark consistently complete the full match when playing.
Analysing the identified players on the ball
We’ve looked at more ‘defensive’ metrics, now we move on to analysing the players on the ball. It is important for this exercise to be relatable to your team. Are you a team that is possession-based? Do you have a more direct approach? Or are you focused on counterattacking? These are just a few possibilities. Whatever your style, this will impact the type of player you are looking for.
I am looking for a player who – according to what the data shows – can get on the ball and be progressive with their passing. I’ve highlighted the following KPIs to help us identify this.
Firstly, to look at the number of times a player gets on the ball and plays, I am using Passes Adjusted to a Team’s Possession. This is followed by Passing Accuracy to see their success rates.
We want to see how progressive they are on the ball. Therefore I will look at the Number of Progressive Forward Passes Adjusted to the Team’s Possession followed by the Percentage of the Players’ Passes which are Progressive Forward Passes.
To further analyse a player’s passing progression, I’ve used the statistic Pass xT Differential to show us the progressiveness of their passing. It is calculated by Expected Threat (xT) for where the pass ended minus xT where the pass started.
For those unfamiliar with xT, it is the chance that the team will score in the next five actions. Like expected goals, it’s based on looking at large samples of past data and building a model on how moving the ball from one area to another contributed to goals being scored.
And finally, we will look at Long Balls from their Own Half to the Opponent’s along with the % of Passes that are Long, to give us further insight into each player’s range of passing.
The use of per 90 stats
The integer statistics we are using will be adjusted to be per 90. These stats allows us to see what a player approximately produces over 90 minutes, and gives us a better insight than totals as it doesn’t take into account minutes played.
This stat can be seen as using a linear approach so it’s important to understand that when using it.
Adjusted by team’s possession statistics
Adjusting statistics to a team’s possession is useful as it gives players a better comparison as it takes away the advantage of high possession team players. This allows us to better understand what players might produce on an equal standing.
Reviewing the data, we can see who gets on the ball a lot and likes to play passes and even with the data adjusted to team possession, we see players from top possession teams being high on the list – Christensen, Akanji and Süle.
The majority of players have high Passing Accuracy with only Mašovic dropping below 80%, however, it should be noted that he plays the most long balls out of the list.
Now, looking at who is more progressive with their passes, interestingly Bundesliga-based players take the majority of the top positions. Süle, Schlotterbeck and Akanji stand out with high results in Progressive Passes per 90 and a high PxT.
Further to this, we see Schlotterbeck plays more long balls than most of his peers so this would be taken into account when considering a team’s approach.
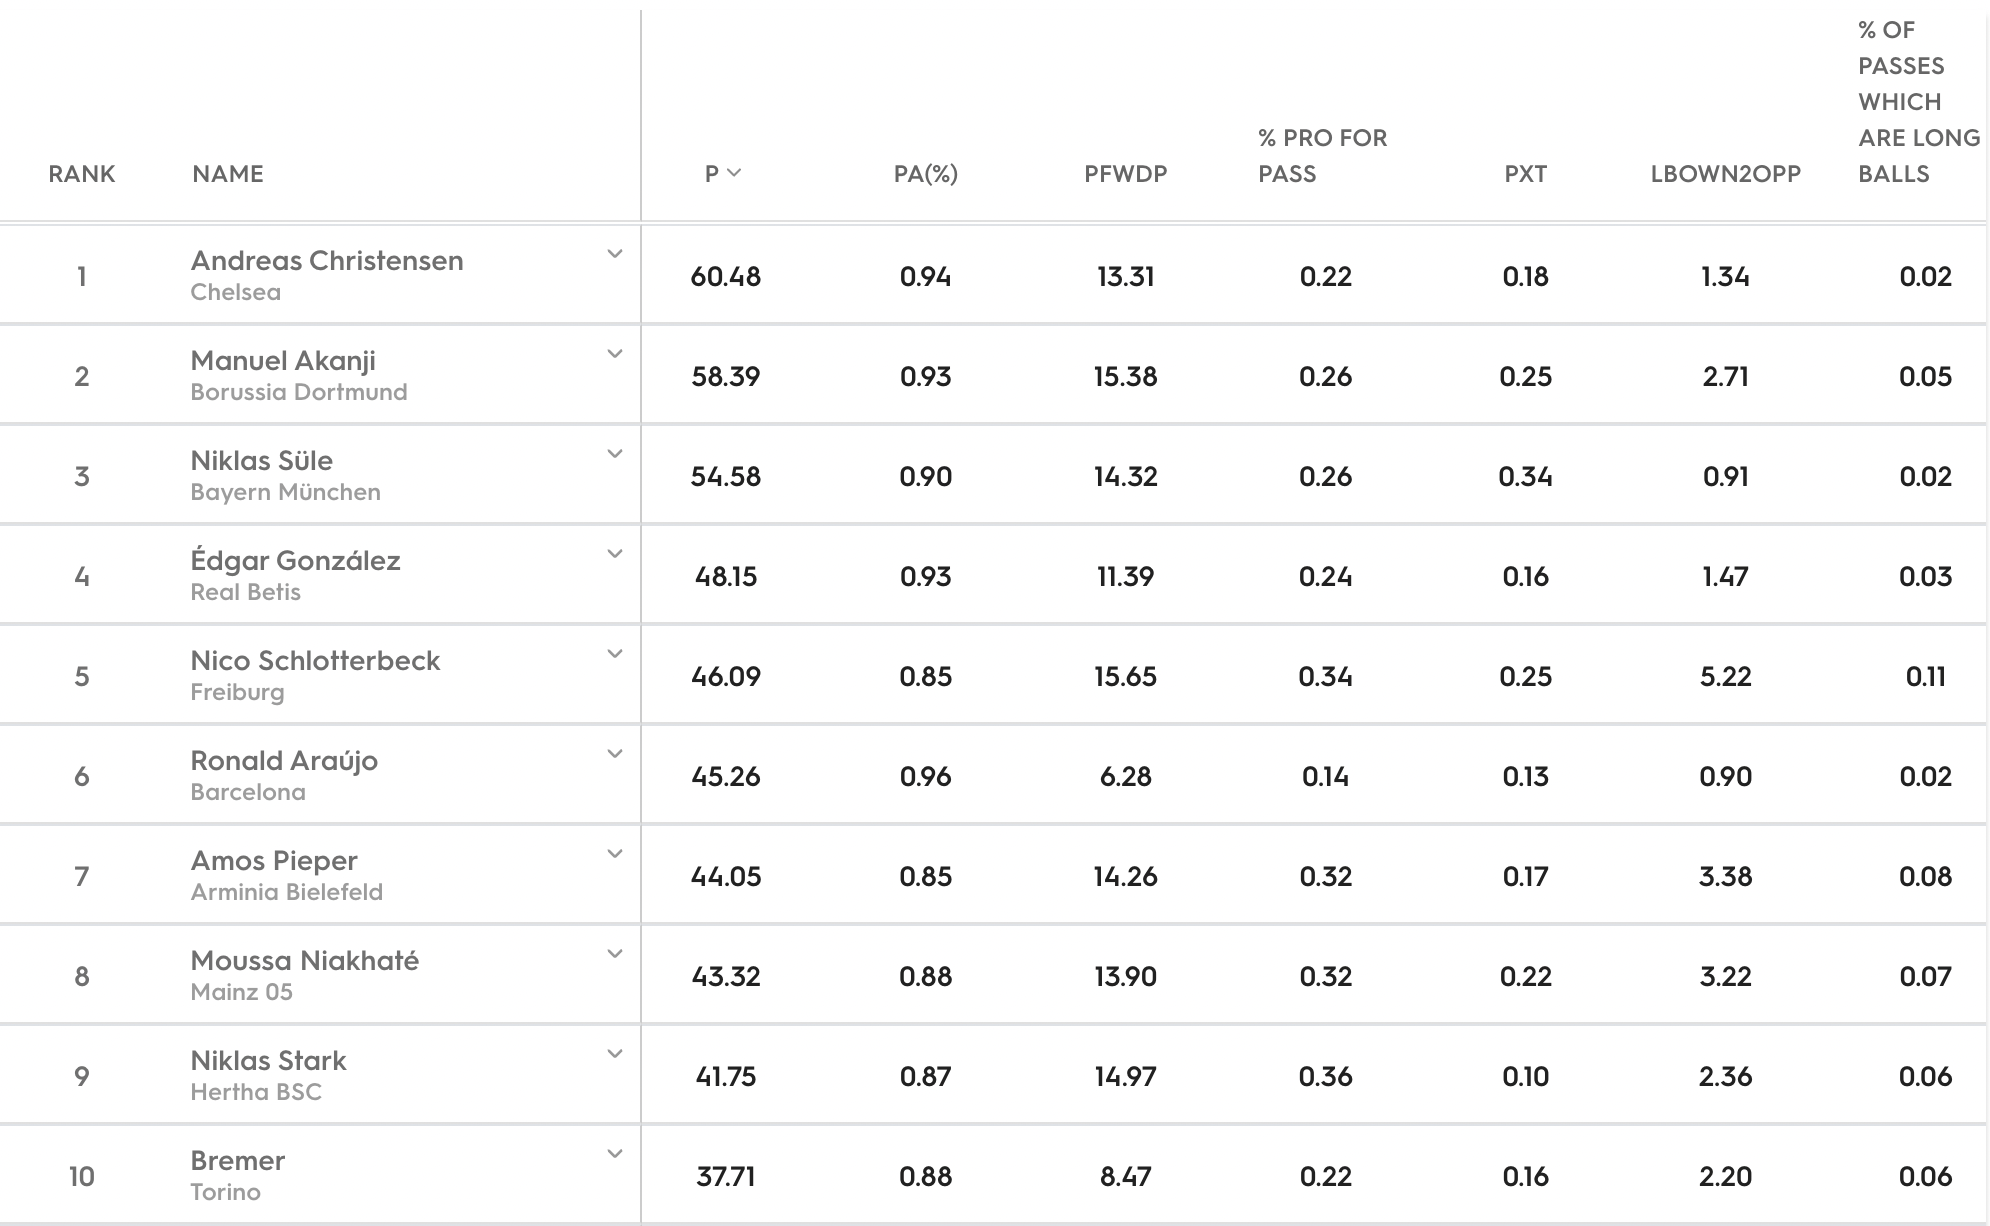
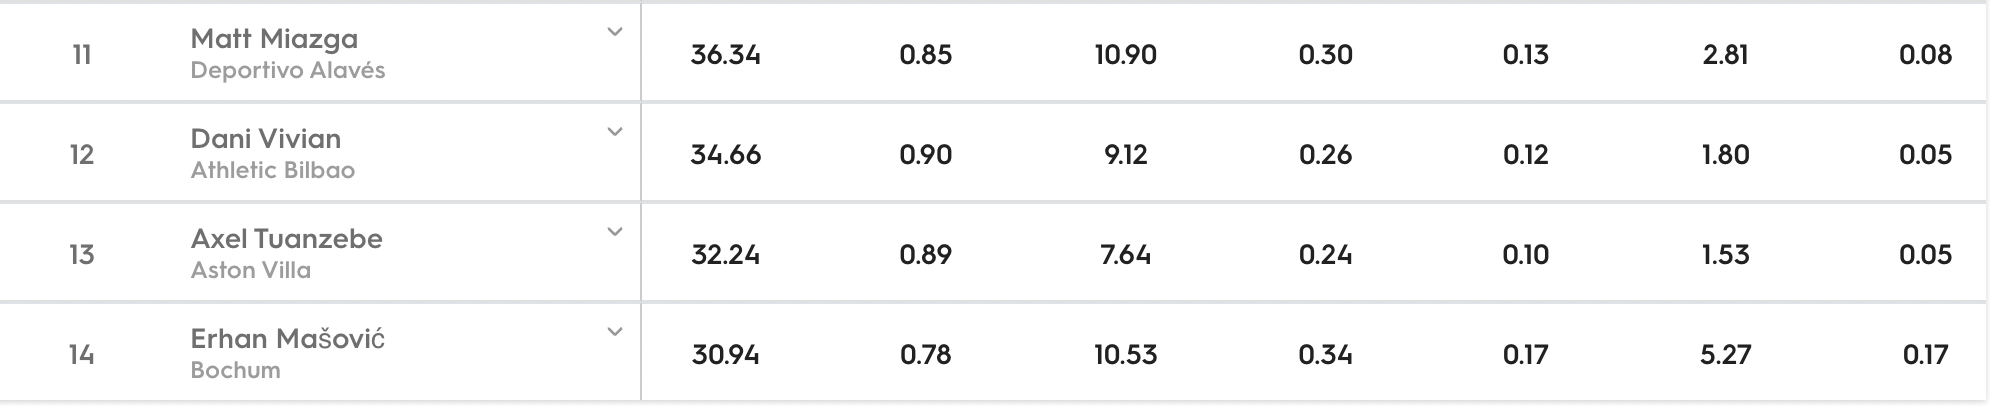

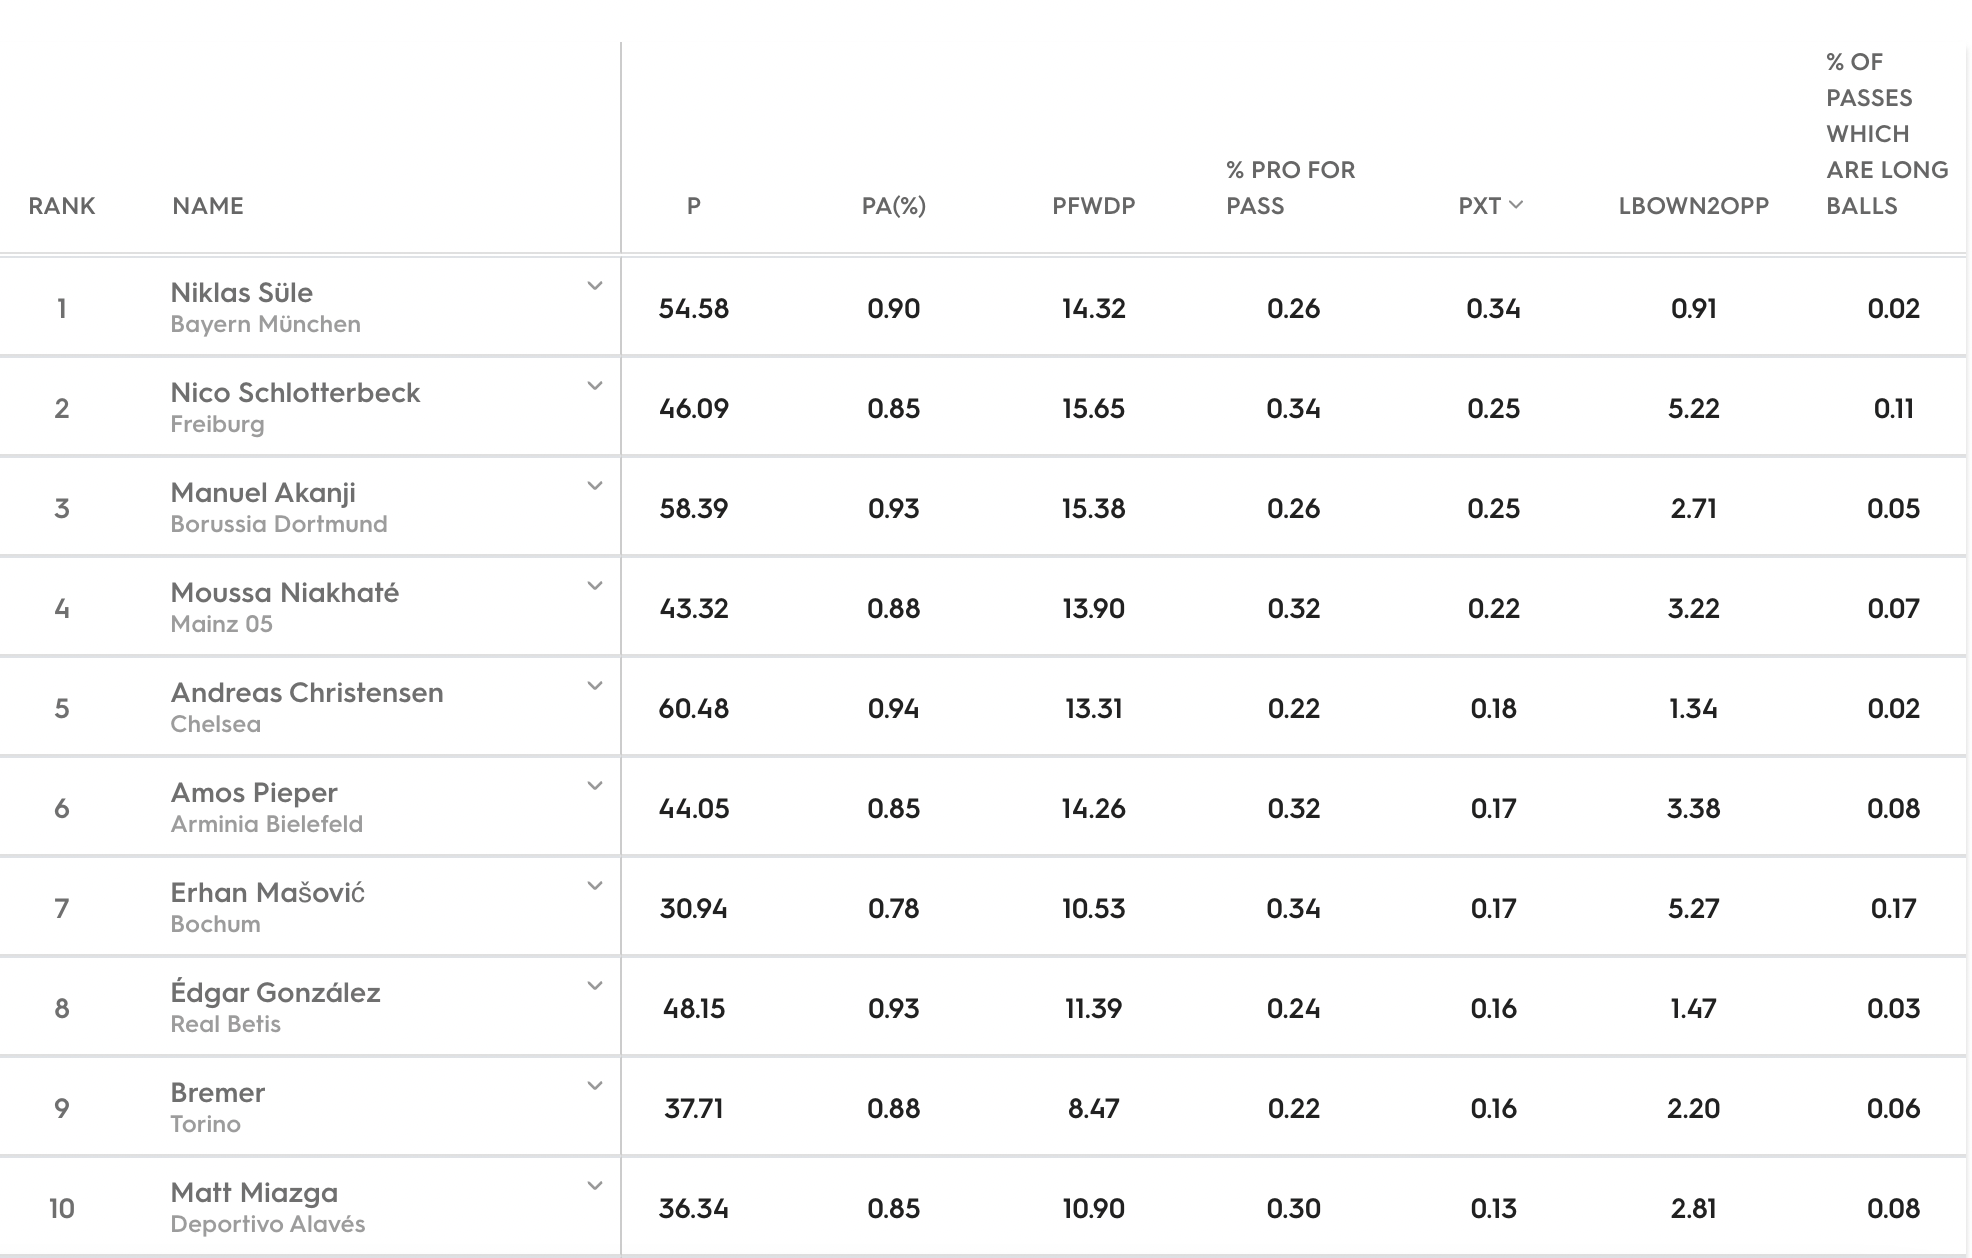


The above carousel includes rankings from left to right: % of Passes that are Progressive Forward Passes, Pass xT Differential, Long Balls from Own Half to Opposition Half, % of Passes that are Long Balls from Own Half to Opposition Half
Deciding who to analyse further
Now we have focused on the selected KPIs, prioritised what is most important to us, produced the data, analysed the output, filtered the data further and studied the backgrounds of each target, we can bring our points together to choose who to start analysing further with scouting and video analysis.
Bringing together the information we’ve collected and analysed, I have selected the following four centre backs to be the first to dig deeper into. I will still continue to manage and review these databases as the season progresses.
Manuel Akanji, Borussia Dortmund
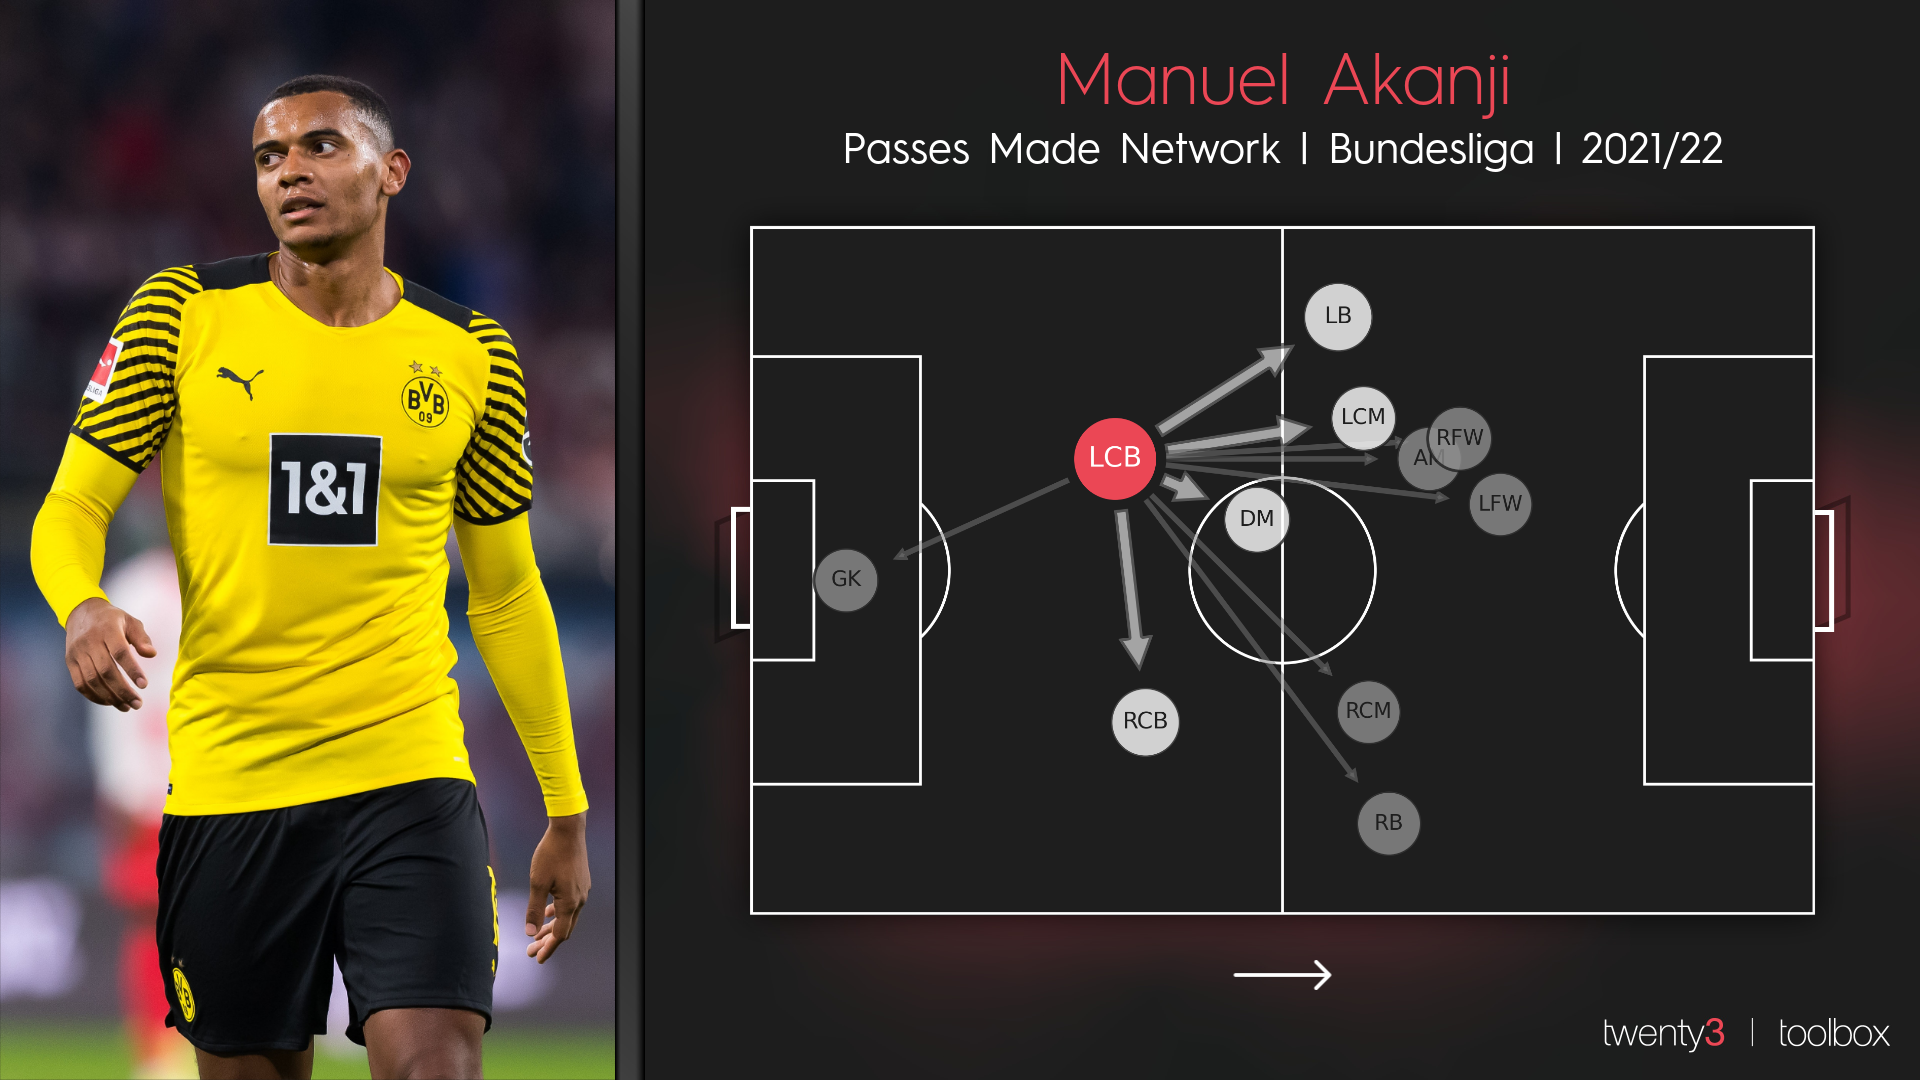
Akanji stood out initially after scoring high in the Defensive Actions and Ground Duel Success Rate metrics. Whilst having good scores in Aerial Duel and Loose Ball Success Rates too.
On the ball, the Swiss international was a standout player, ranking highest for passes with a very strong accuracy. He is also shown to play a good number of passes forward.
He plays at a high level at Borussia Dortmund with a high availability and 90-minute completion rate but doesn’t have a long contract.
Bremer, Torino
He achieved good defensive results for Torino who have conceded a low amount of goals in Serie A. He scored particularly well on Defensive Actions and Ground Duels.
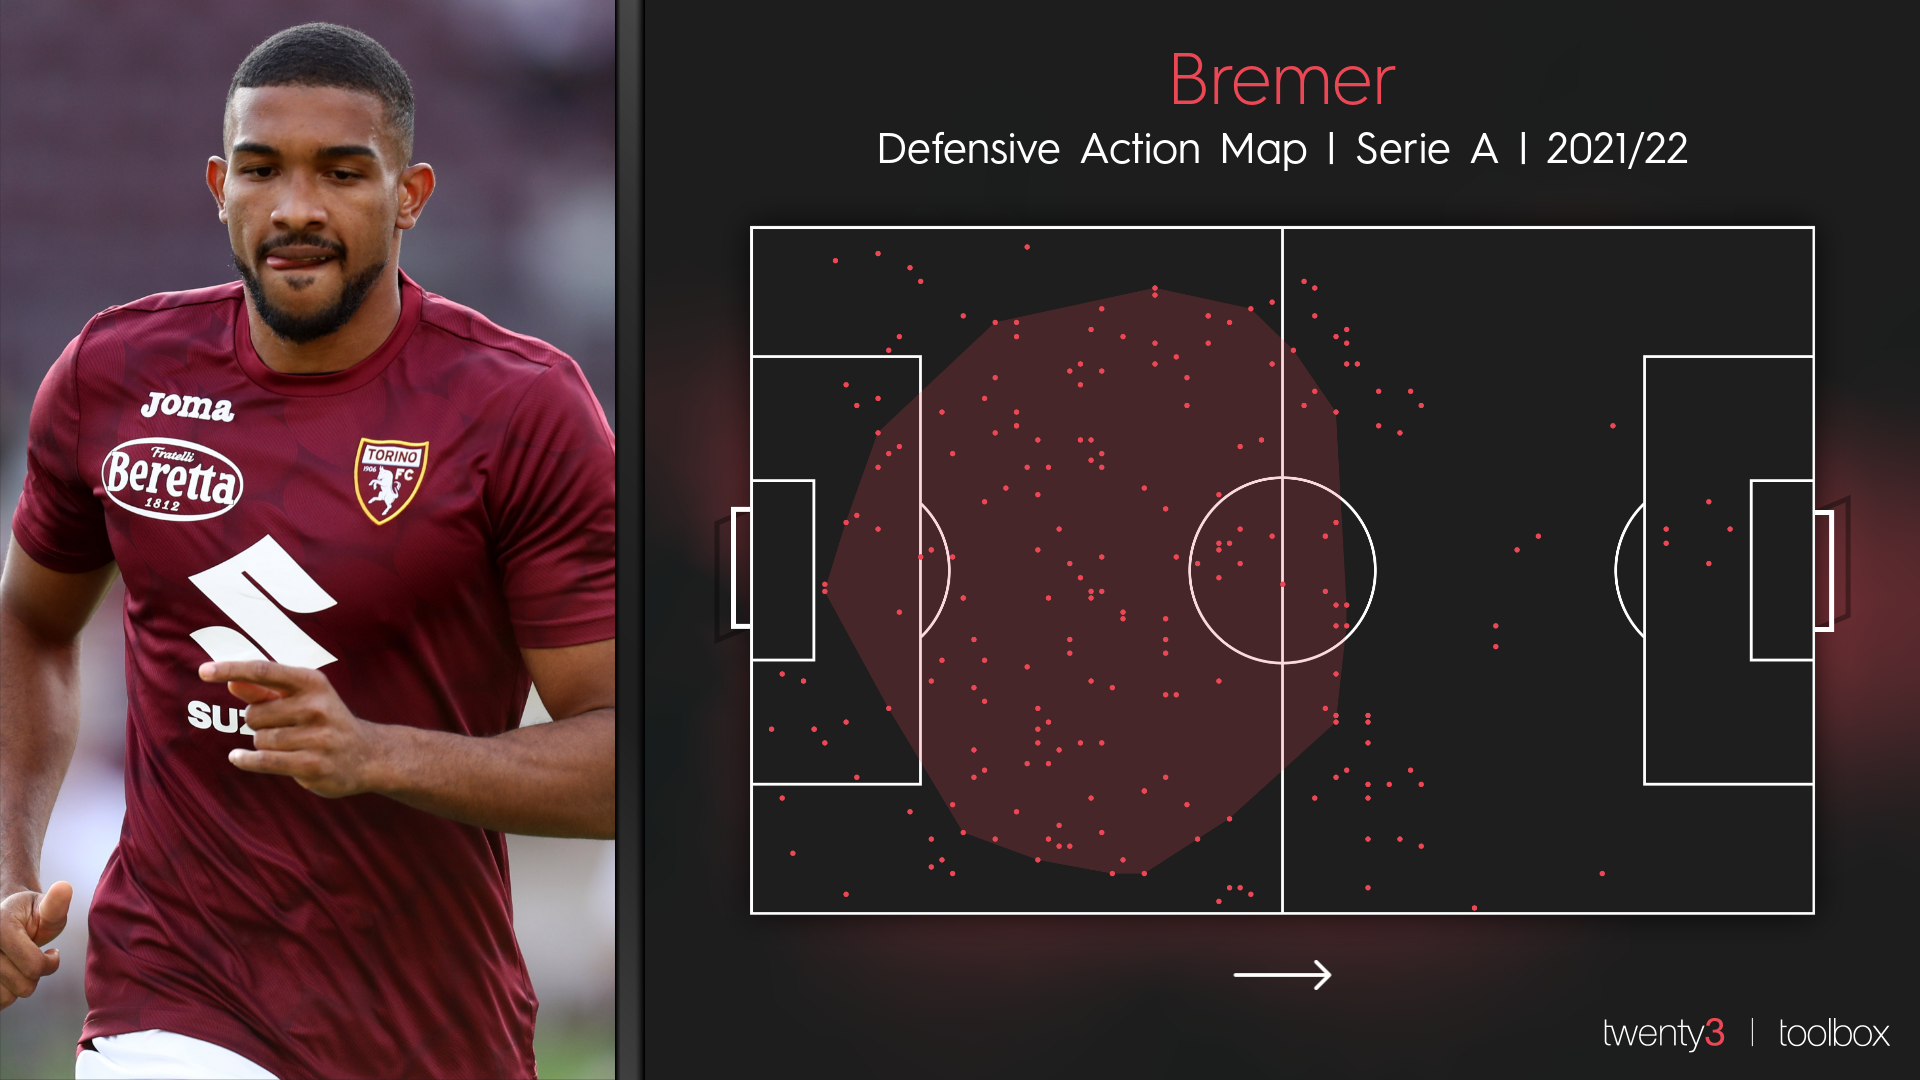
On the ball, he scored in the top half for PxT and long passing, giving insight into his range of passing which should be looked at further.
He’s shown this season he can produce 90-minute performances consistently.
Andreas Christensen, Chelsea
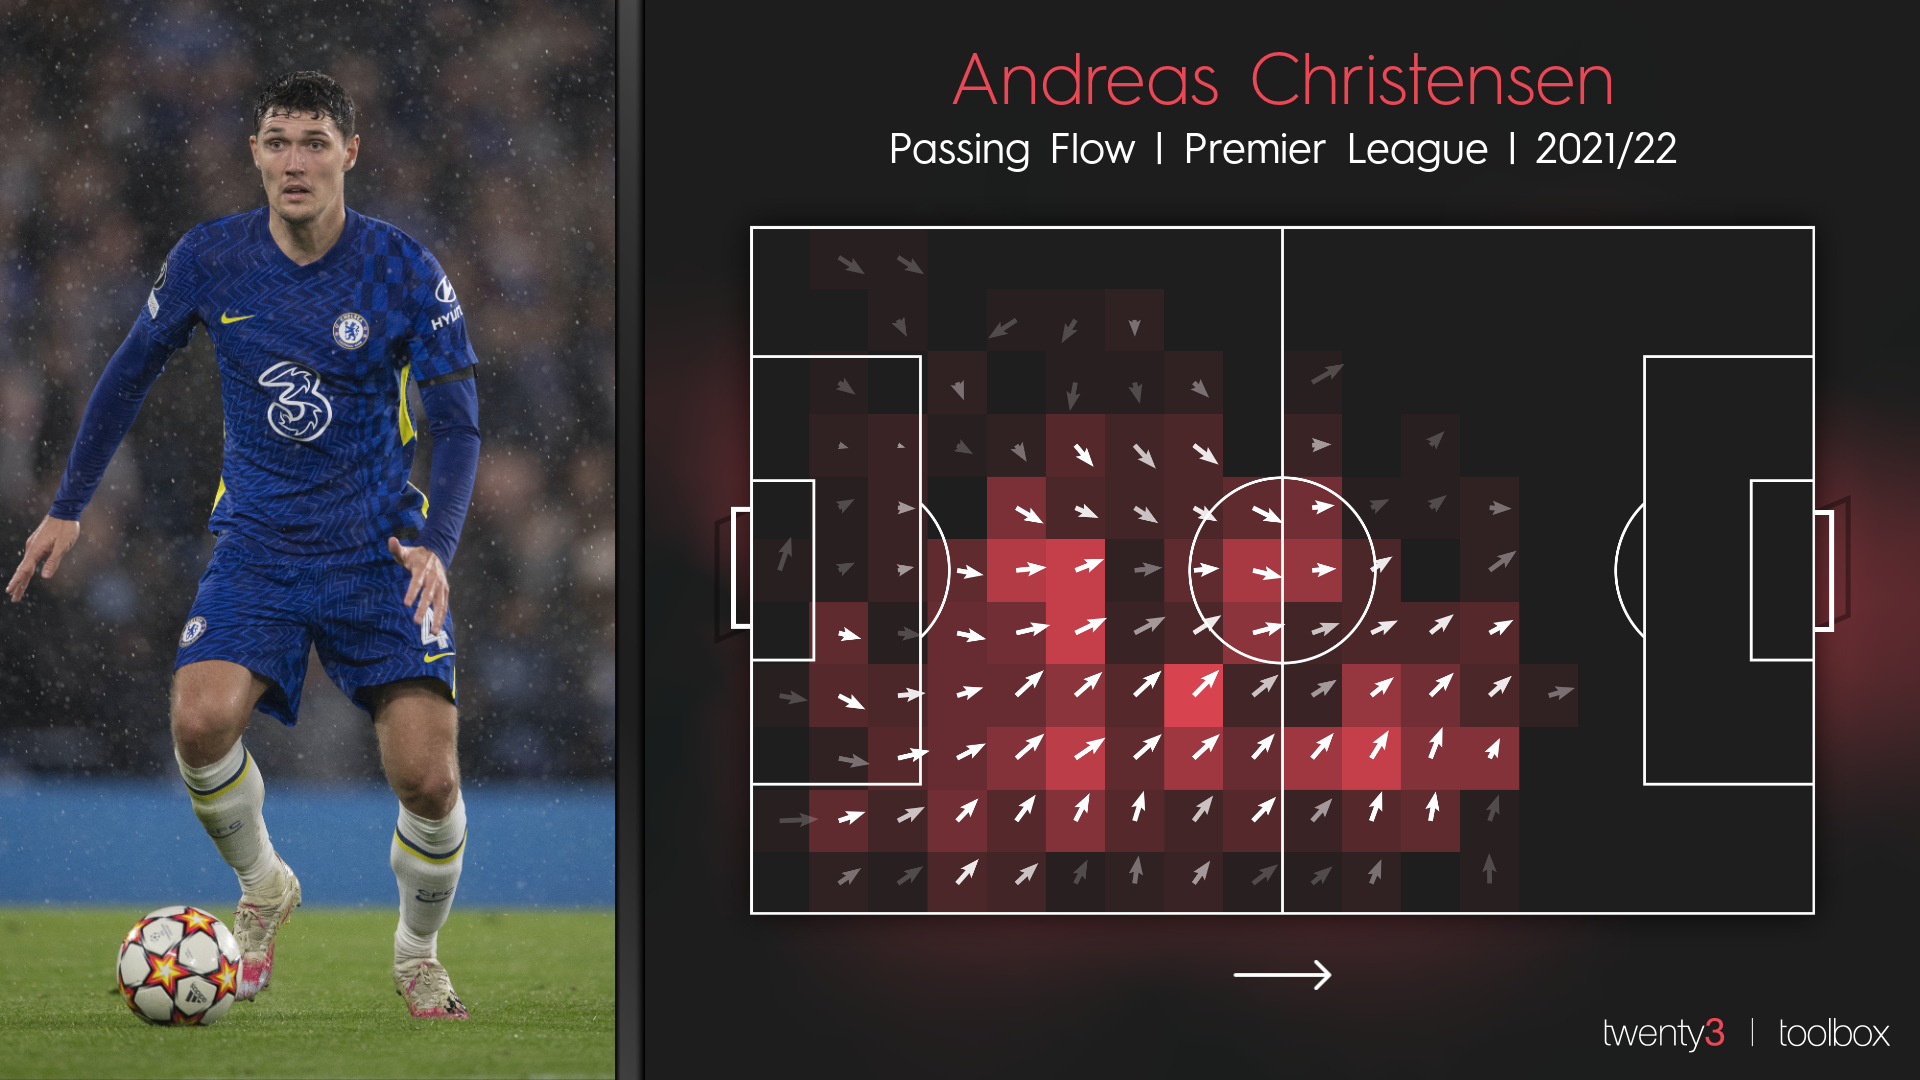
Christensen stands out more for his on the ball statistics but he also scores well on his defensive KPIs particularly in Loose Ball Success Rate.
The data shows he favours a short passing game with good accuracy.
Furthermore, he hasn’t signed a new contract which means he could be available very soon.
Édgar González, Real Betis
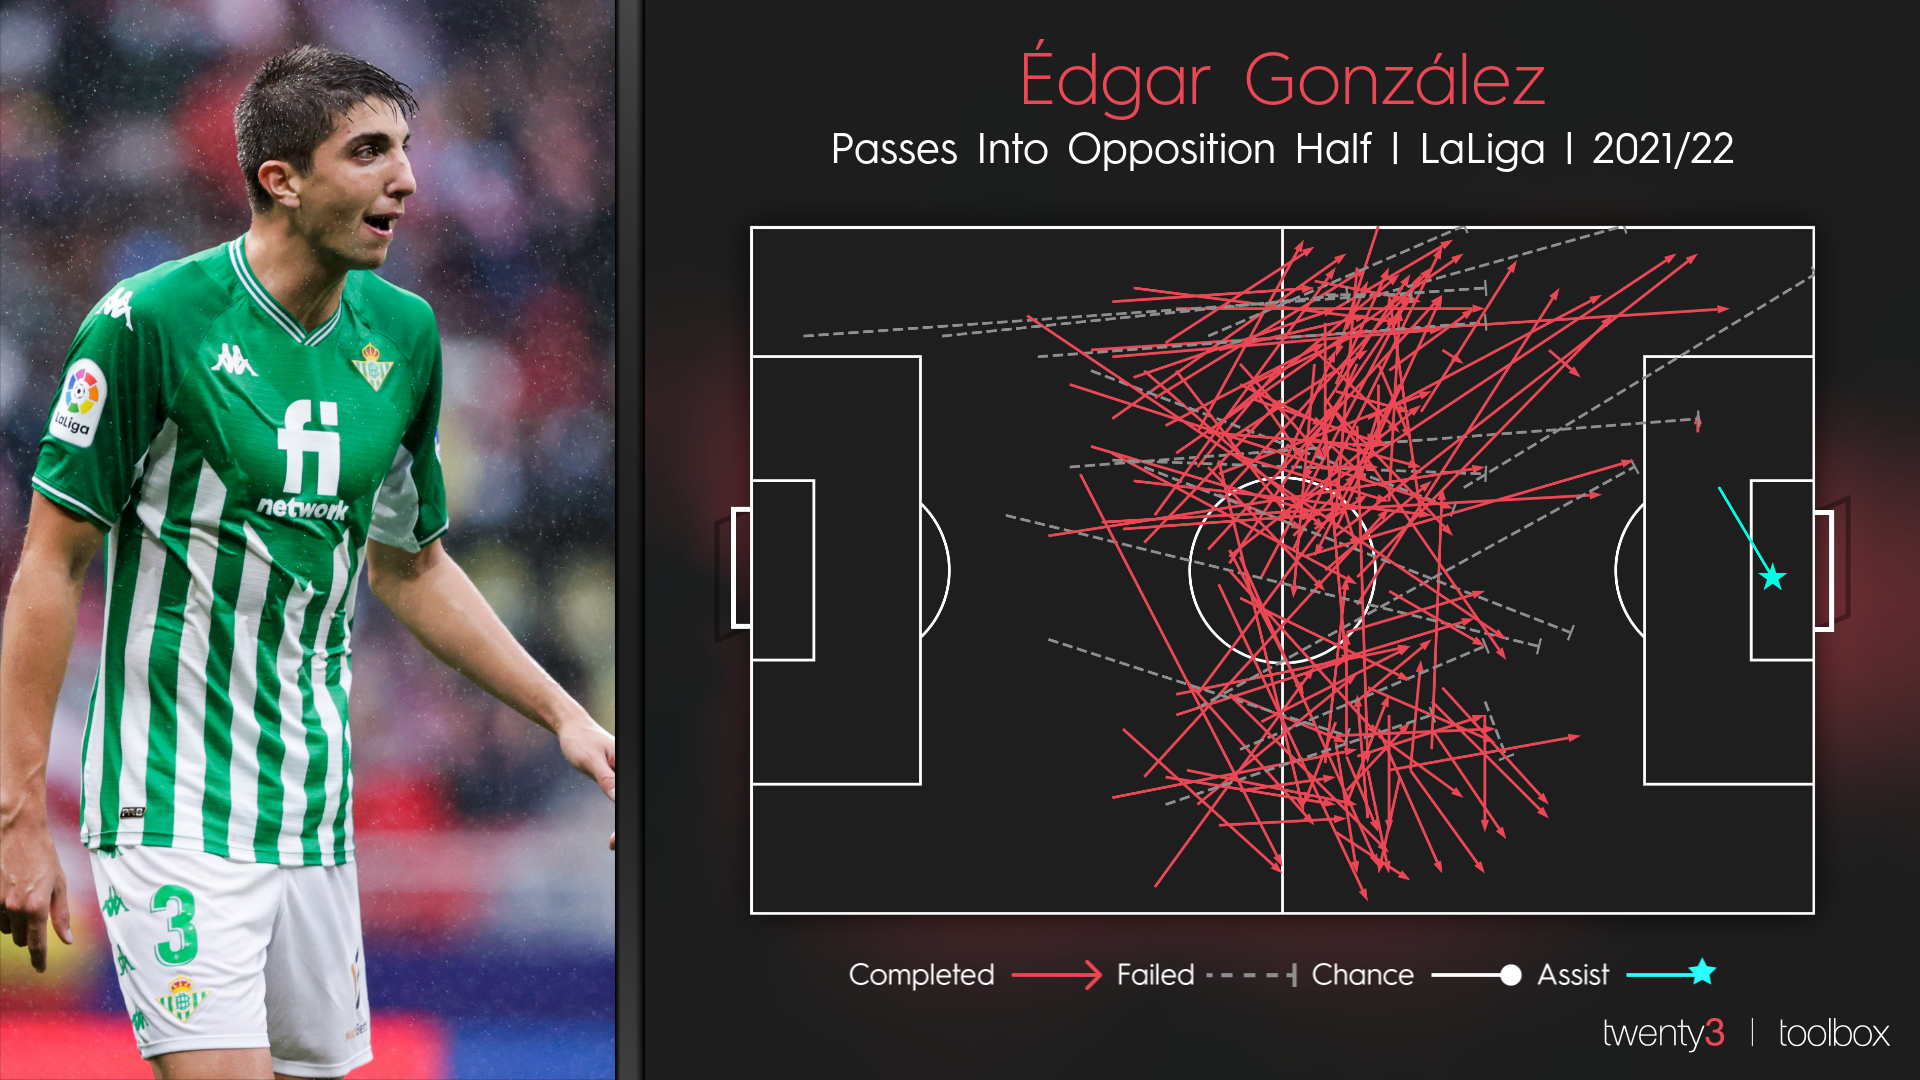
González ranked highly both in defensive and passing KPIs. Defensively, he ranked high for Defensive Actions Success Rate and also when dealing with Loose Ball Duels.
On the ball he ranked high for number of passes and his accuracy. Furthermore, he scored well for Progressive Forward Passes.
His availability and 90-minute completion is good, only being unavailable for one league game so far this season.
The importance of video and live scouting
Now we have highlighted the potential targets using data, it is vital that we watch these players on video and in a live setting. It is always important to note that data can’t give us all the information or the context when data is collected.
Data on players isn’t collected in areas such as a defender’s positioning, their ability to read the game, their communication and leadership… to name a few.
It is important that data and video/live scouting complement each other. I don’t believe anyone could confidently judge a player on data alone.
From our viewings, we will build scout reports – which you could do using Twenty3’s Power Reports tool – and further information that we hope will coincide with our data or even challenge it as we delve deeper.
This will ultimately provide us with more information and allow us to build a player profile which will help us make better decisions.
Player Profiling
As I collect more and more information on players, I would build a profile on the player. This could include the following:
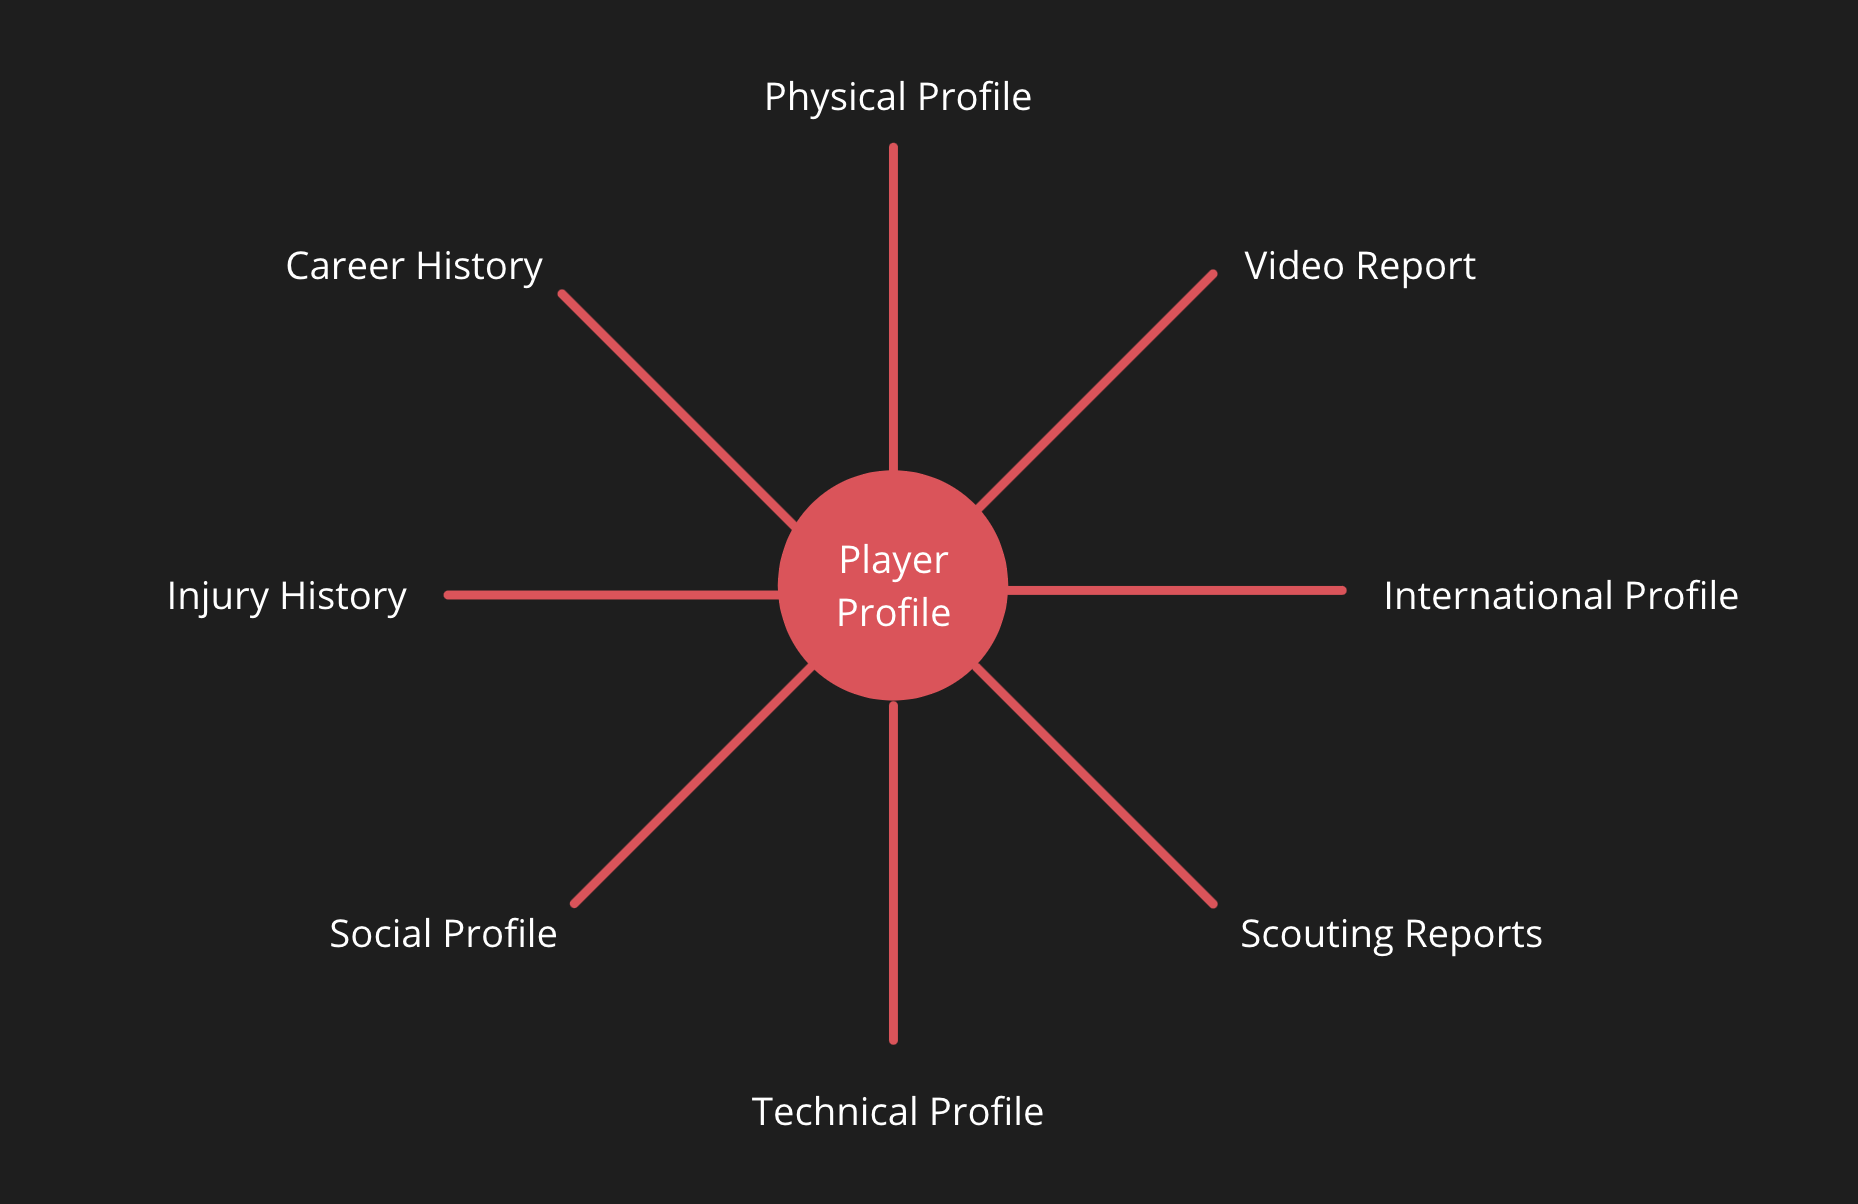
Conclusion
This study showcases a methodology and the use of defensive success rates as a way of analysing central defenders for recruitment purposes and further breaks down the process to filter out targets utilising more data.
It is always important the use of data is part of a wider process and it is certainly required to complement other areas, but the huge advantage of the data, particularly the Event Lab, is that it allows us to filter targets and give us scope to analyse players in an effective and efficient manner.
Following these processes offers you an insight into identifying targets and gives you a foundation to further scope out the players across a number of leagues.
Further adjustments
It is always important to reflect on processes and see where they can be adjusted or improved. Reviewing this process, I’ve highlighted a few areas which could be developed.
- This case study focused on the use of % success rates to analyse defenders but we can take this further with additional defensive statistics. This will create a wider picture of the player.
- You break down the type of player further with the use of preferred foot and height filters.
- You could add additional context to statistics in the Event Lab by filtering it down to specific areas of the pitch or focusing on similar formations to your own. This is relevant to the highlighted players as Christensen and Bremer have played in a back 3 this season whilst González and Akanji have predominantly played in a back 4.
- Analysing data over seasons: I only took into account this season’s data for illustrative purposes in this study, but further analysis could track a player’s consistency over prior campaigns too for a larger sample size.
- Further analysing the difference in data from different leagues, this could be done by identifying what the top results are for that league and comparing the player to their own league, then highlighting the top players from each league for comparison.
All the graphics and visualisations in this article use Wyscout data and were produced in the Twenty3 Toolbox.
If you think the Toolbox could help your organisation either in the Media or Pro industry, please don’t hesitate to request a demo here.