
Inside the world of Twenty3 Smart Graphics

In a world where we have Siri, cars that park themselves, and roombas, why manually make graphics by typing in all the text yourself?
Why not just hook up bespoke, branded templates directly to a database, a suite of data visualisations, and your image library? Sounds useful. Sounds smart.
Well, that gives us a perfect segue into Twenty3’s Smart Graphics tool.
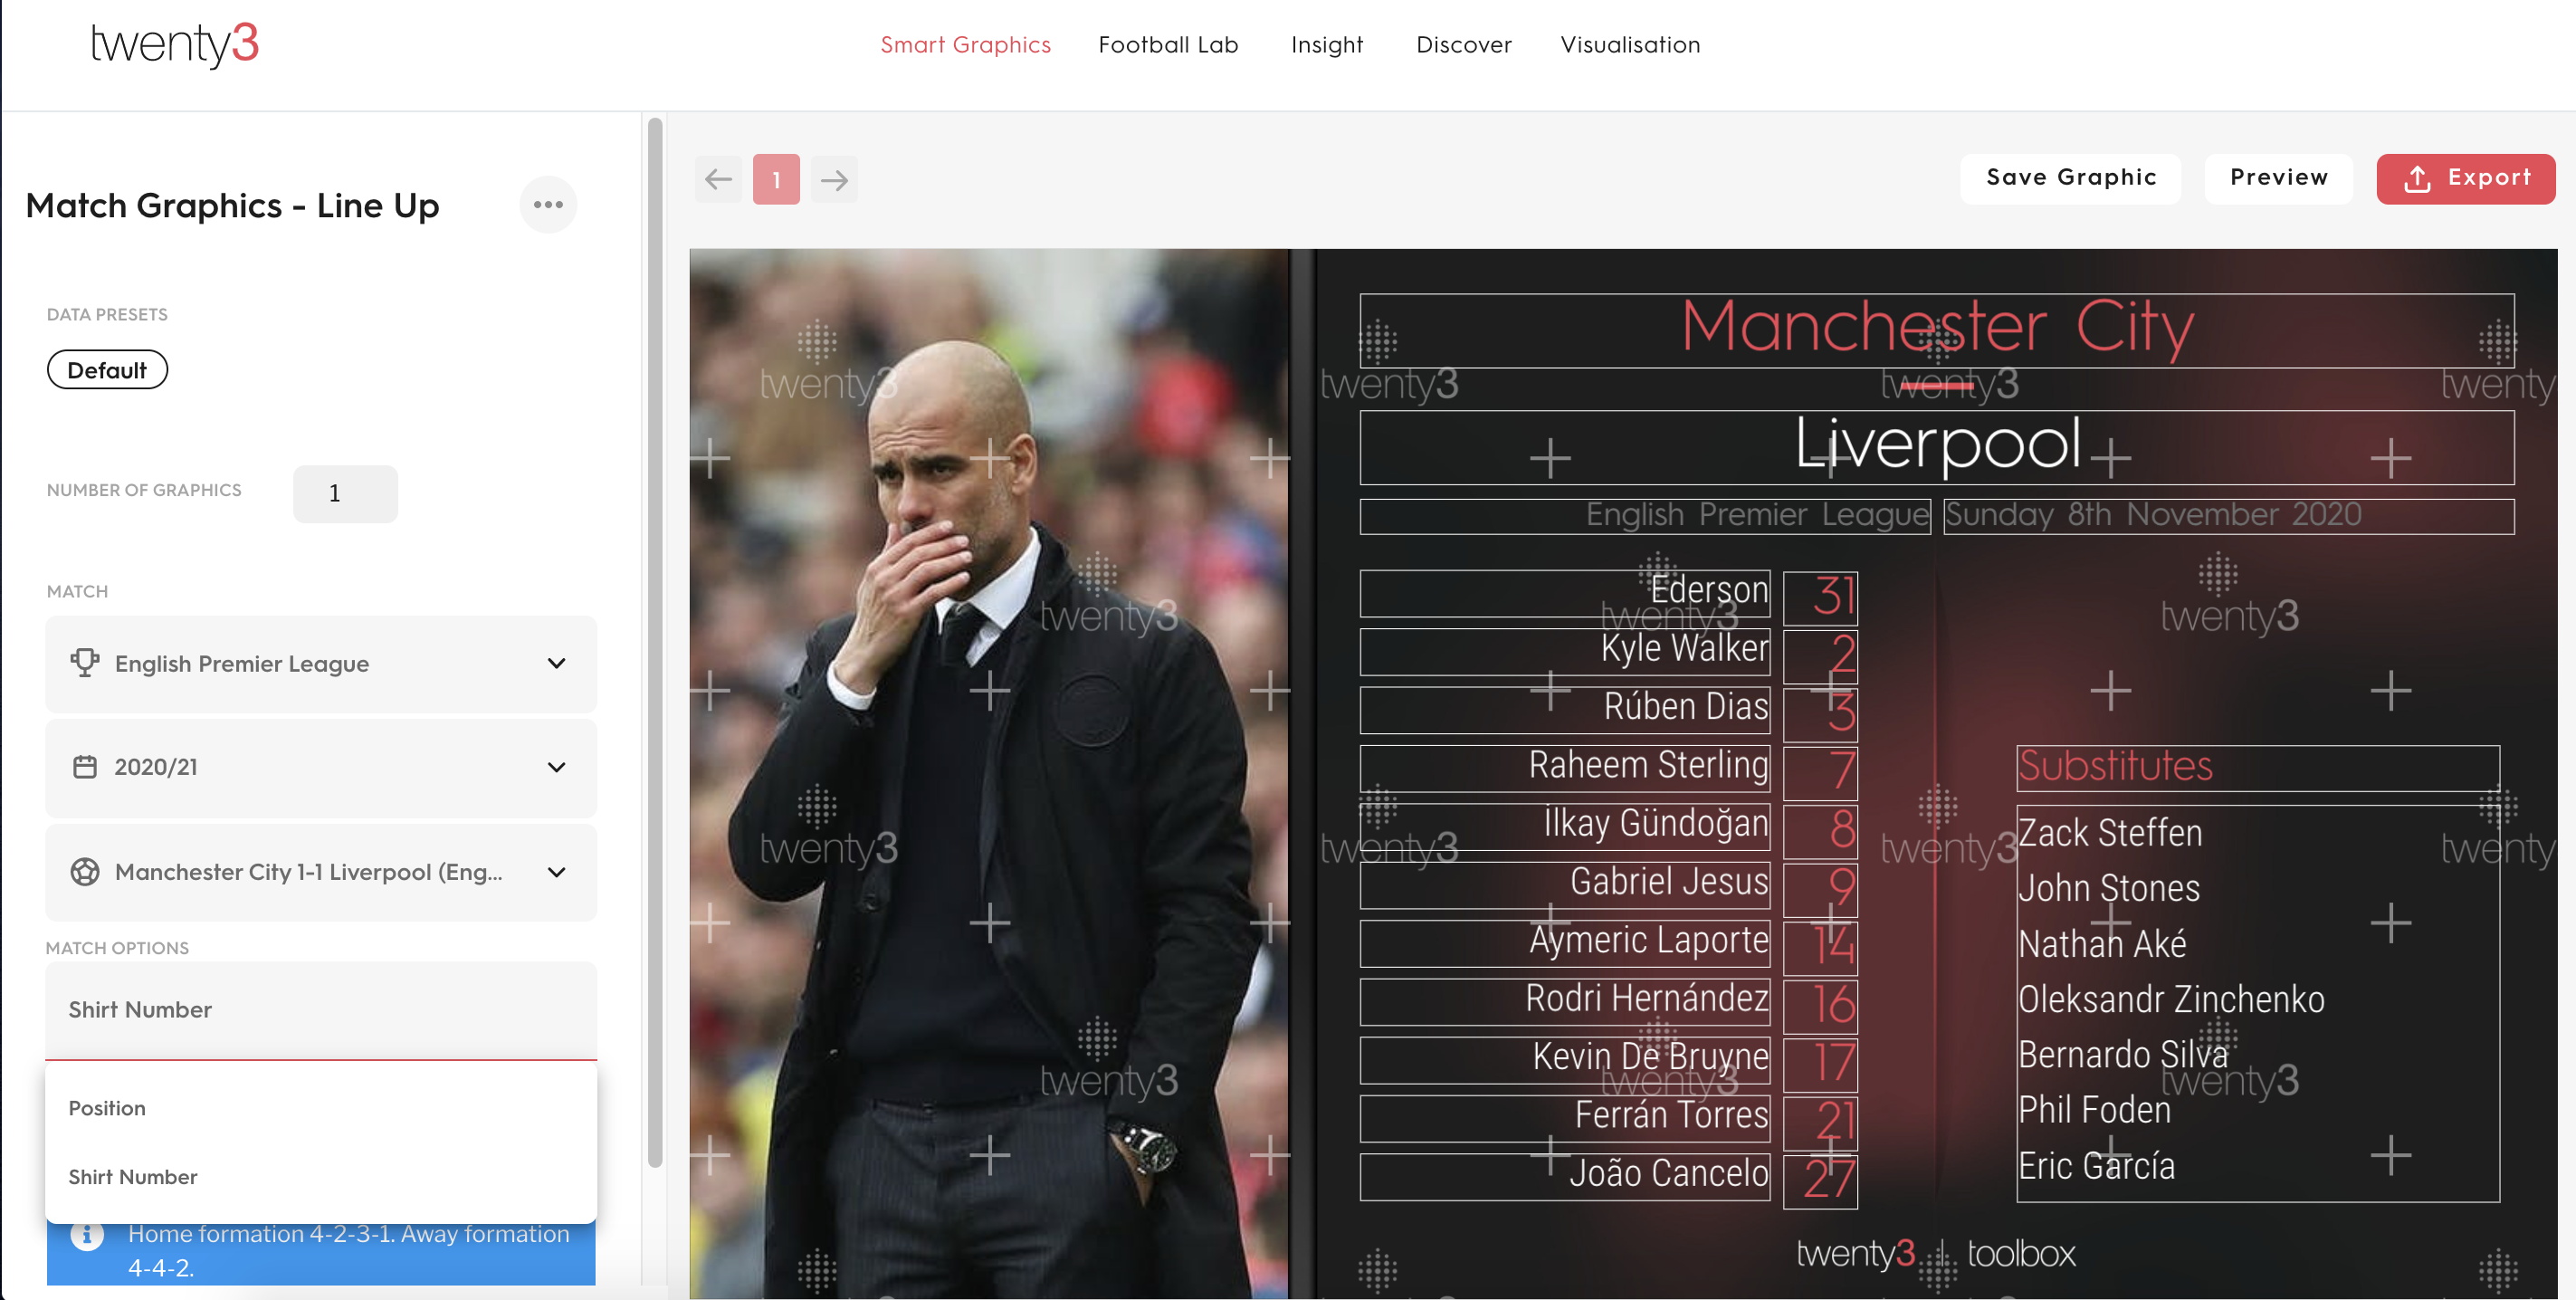
Instead of having to manually enter names and numbers, a connection to the data (whichever provider you use) pulls the information through into designated fields, which are incorporated into the design of the templates. For things like match scoreline graphics, all users need to do is select a match, and the rest takes care of itself.

For line-ups, templates can pull through substitutes as well as the starting line-up. We know that there are different preferences around how to present a line-up too, so we have two options: ordered by position (as given by the data provider), or by shirt number. [If sorted by shirt number, the goalkeeper always goes first].
But of course, you may want something more complicated than this. With all of our templates, you can save ‘data presets’, which come in handy when you want to produce graphics that could be about players in various positions. One data preset might have statistics for forwards mapped, while another could be with a totally different set of stats suitable for goalkeepers. Everything on the template can still be edited, but the preset makes for a good and speedy starting point.

The same is possible for visualisations too.

These aren’t the only features. Different user authorisation levels are available so that a whole team can use the templates but only the necessary individuals can create and edit layouts. As well as the auto-fill fields, text can be manually added, and the size adjusts automatically to the size of the box it’s in. The range of data that can be pulled from a data provider includes names, teams, ages, and shirt number.
The range of features shouldn’t distract from the flexibility. Everything can be themed according to your brand, from the design of the templates (something our in-house design team can help with) to the fonts you use to the colour scheme of the data visualisations.

Make making graphics more automatic. Make graphics, smarter. Use Smart Graphics. (Come to me for your marketing slogans).
If you’d like to learn more about Smart Graphics, or our other products and services, don’t hesitate to get in touch.