
A shortcut to navigating the world of football statistics
A certain section of technology experts will live and die by Ray Kurzweil’s ‘law of accelerating returns’. Evolution happens exponentially, the theory goes, for technology as well as for anything. People build on the knowledge of what’s come before, and that knowledge helps them get new knowledge faster.
This won’t be a post about that theory, but let’s take it at face value.
In the same way as we went from semaphore to telegram to fax to Facebook, understanding football statistics should be easier now than at any point in the past. If you’re reading this blog and you don’t yet know your xG from your elbow, then you’re in luck: this is the best time to start learning.
Here are the things that our old and decrepit (in stats years) in-house data expert, Mark Thompson, wishes he knew when he started out:
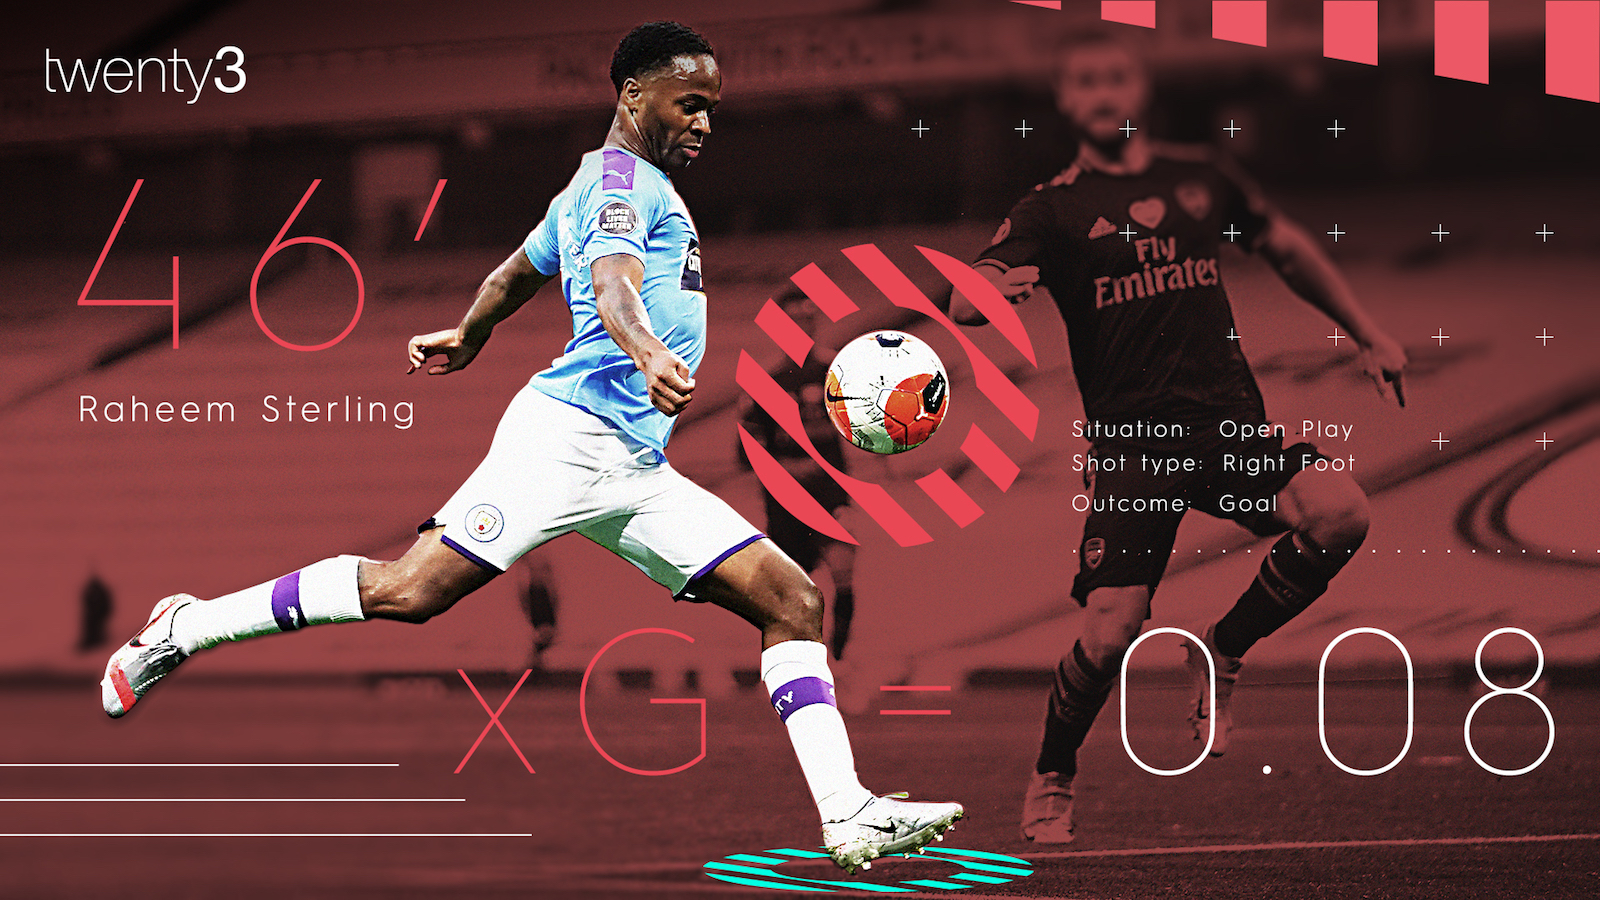
Expected goals is a measure of chance quality, using hundreds of thousands of past shots to make that measurement
That’s a relatively succinct definition for what can be a complex statistical model, but it’s only the concept that you need to understand.
It’s also worth bearing in mind that xG captures a lot of things, but not everything. It’s true that a particularly unusual spin on the ball might tangibly affect the chance of scoring in a way the model doesn’t pick up, but the model will pick up things like distance and angle to goal and approximately how clear a player’s sight at goal was.
‘Stats are what a person does on the pitch’ sounds stupid in its simplicity, but it’s a useful frame of mind to have
The reason as to why we have ‘expected goals’ as a metric is because people ran statistical models to see what made some shots better than others. Similarly, some stats (e.g. shots) are much more clearly related to a team’s outcome than others (e.g. passes).
Just because a player does a lot of one thing doesn’t necessarily mean that it’s strongly worthwhile. Data scientists (people who make statistical models, basically) will often try and look for what is worthwhile and what isn’t, but the expert opinion of people is also important too.
When you recognise that ‘stats are what a person does’, it’s easier to think about whether a player has a high figure for a particular stat because they’re good or because that’s the role they play in their team.
People will also often talk about ‘per 90 minutes’ — this is just a simple way of making sure that players at the top of lists aren’t just ones who play the most football. The figures are compared to the amount of time spent on the pitch (e.g. 900 minutes would be 10.0 90s, 945 would be 10.5).
‘When a measure becomes a good target, it ceases to be a good measure’
This is Marilyn Strathern’s snappy summary of Goodhart’s law, and in footballing terms, it could be called ‘the Andre Villas-Boas at Tottenham effect’.
Possibly under the influence of early stats-based knowledge that pointed to successful teams taking more shots, AVB’s Spurs absolutely peppered the opposition goal in matches. And yet he (just) missed out on the Top Four and left the club with them in seventh.
More shots are an indicator of a good team, but it turns out you can’t hack your way into being a good team by taking lots of shots from wherever you want. A backlash to possession football came from a similar effect, where teams started to prioritise possession mostly because possession percentage was an indicator of the good teams.
It’s useful to think of this alongside ‘stats are what people do on the pitch’. For example, just because a player makes a lot of dribbles or tackles it doesn’t necessarily mean that they’ll be even better if they make even more dribbles or tackles.
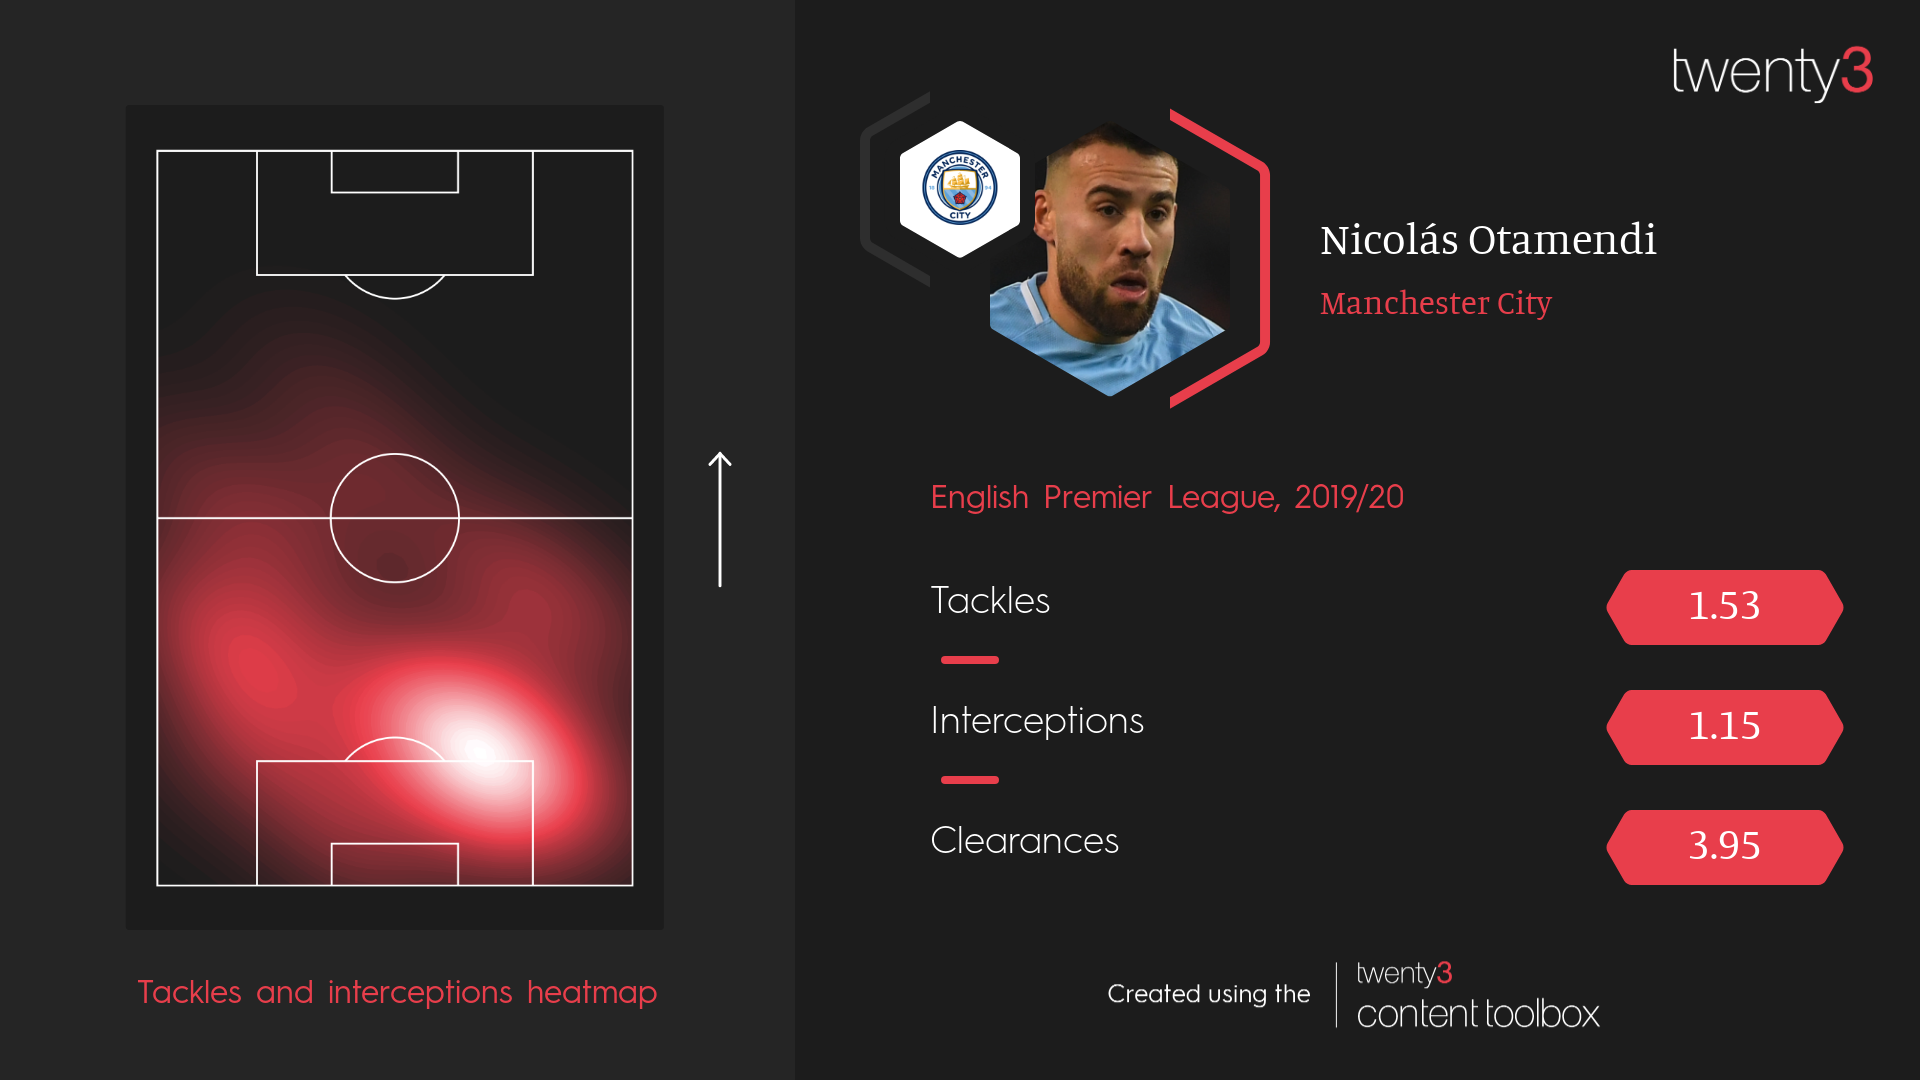
Defensive stats
Defensive statistics deserve a special mention of their own after these two points because they’re affected by them more than attacking stats are.
There are only a limited number of ways to score, and to create chances, in football. You score by shooting; you get chances by dribbling or passing.
There are a lot more ways to defend, and the most basic one – collective team shape – doesn’t show up very clearly in the data. As I’ve mentioned before, stats are just what a player does on the pitch, and so with defensive players in particular, it’s worthwhile stopping for a moment to think about what an individual is supposed to be doing on the pitch.
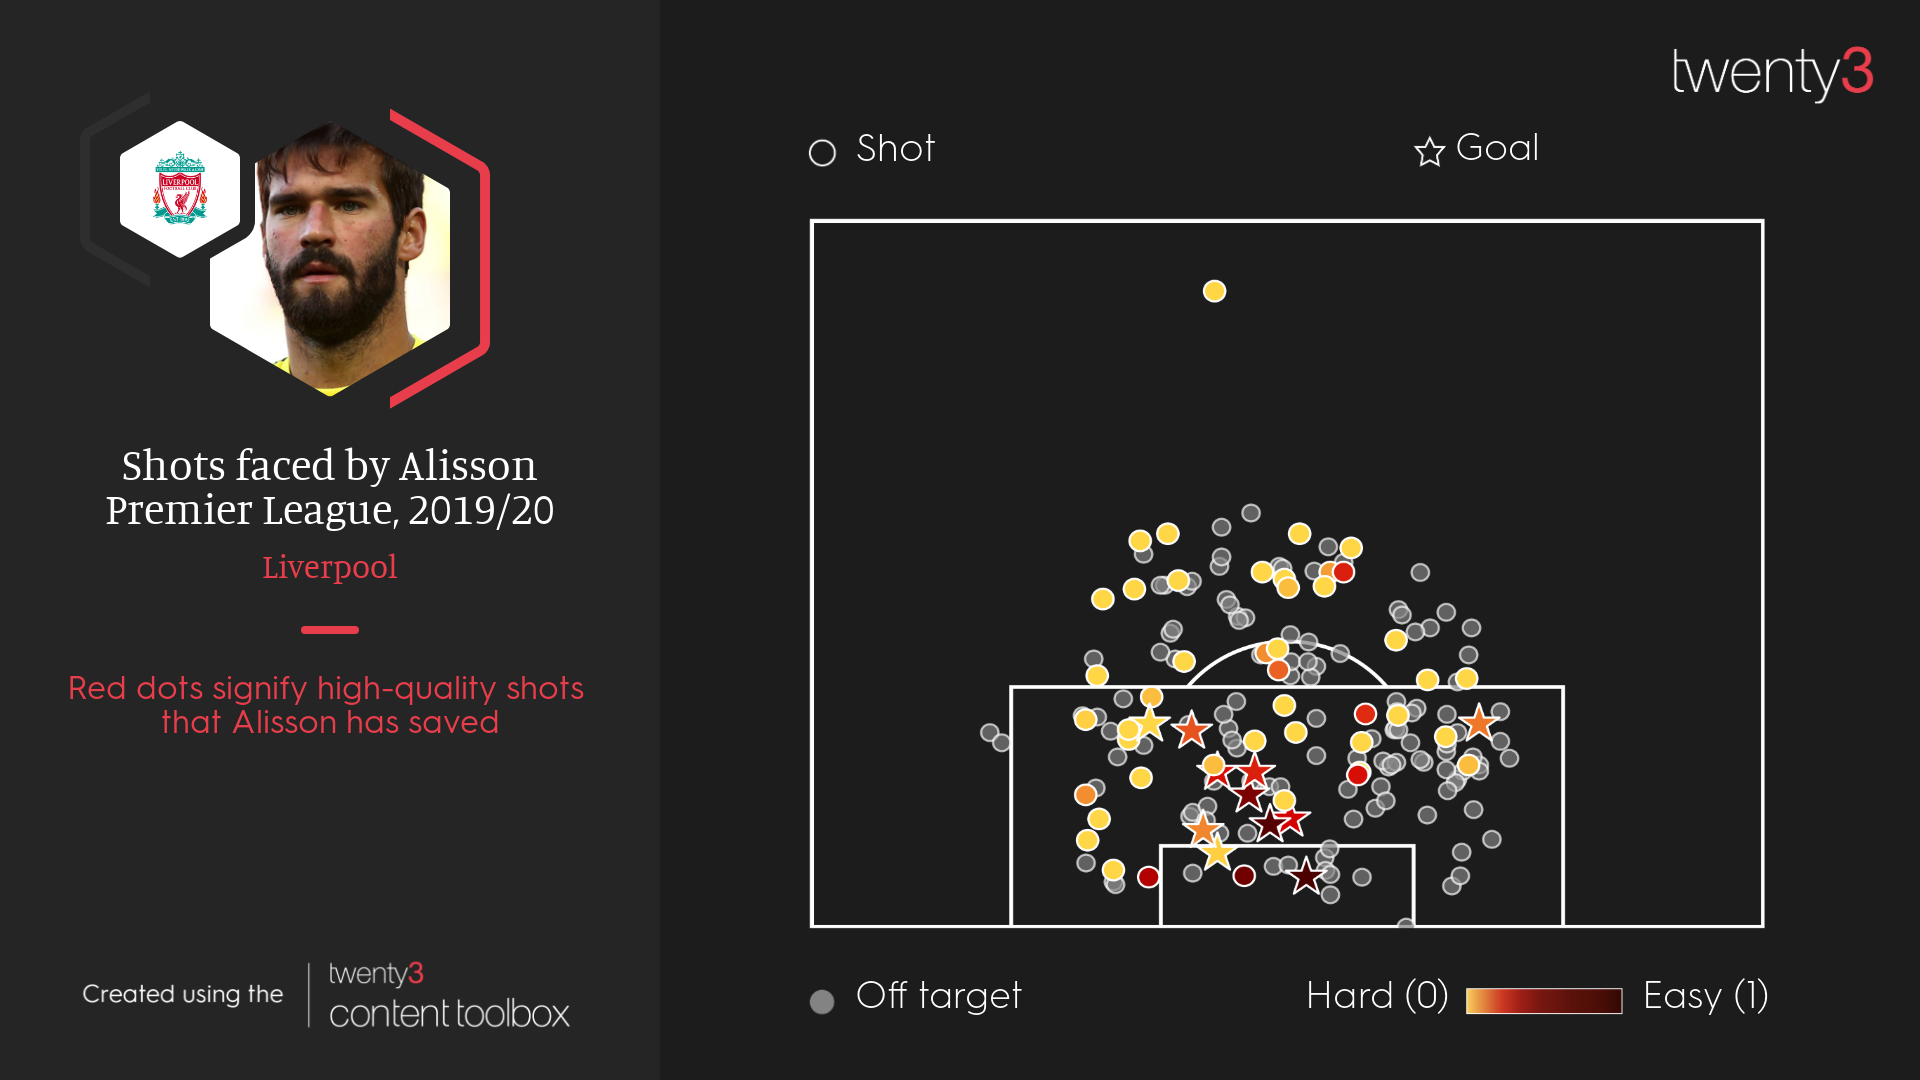
The flood defence system of goalkeeping
Unlike defending, where there many different ways to do the job, there are relatively few ways to measure what goalkeepers do. Other than collecting crosses, goalkeepers tend to only be called on in moments of real danger. Like a flood defence system, you don’t tend to think about them until it really matters.
Because of that, it can be tempting to look at how many floods (or goals) they let in. But, as we’ve seen with expected goals, some shots are more dangerous than others, and so some saves with be more valuable than others.
Most data providers have an ‘expected goals on target’ or ‘post-shot expected goals’ model (names vary but the concept is the same). These models do the same job as ‘regular’ xG, but they add in an extra bit of information: the part of the goal that the shot was flying towards. Down the middle is, of course, less likely to go in, towards the top corner is more likely.
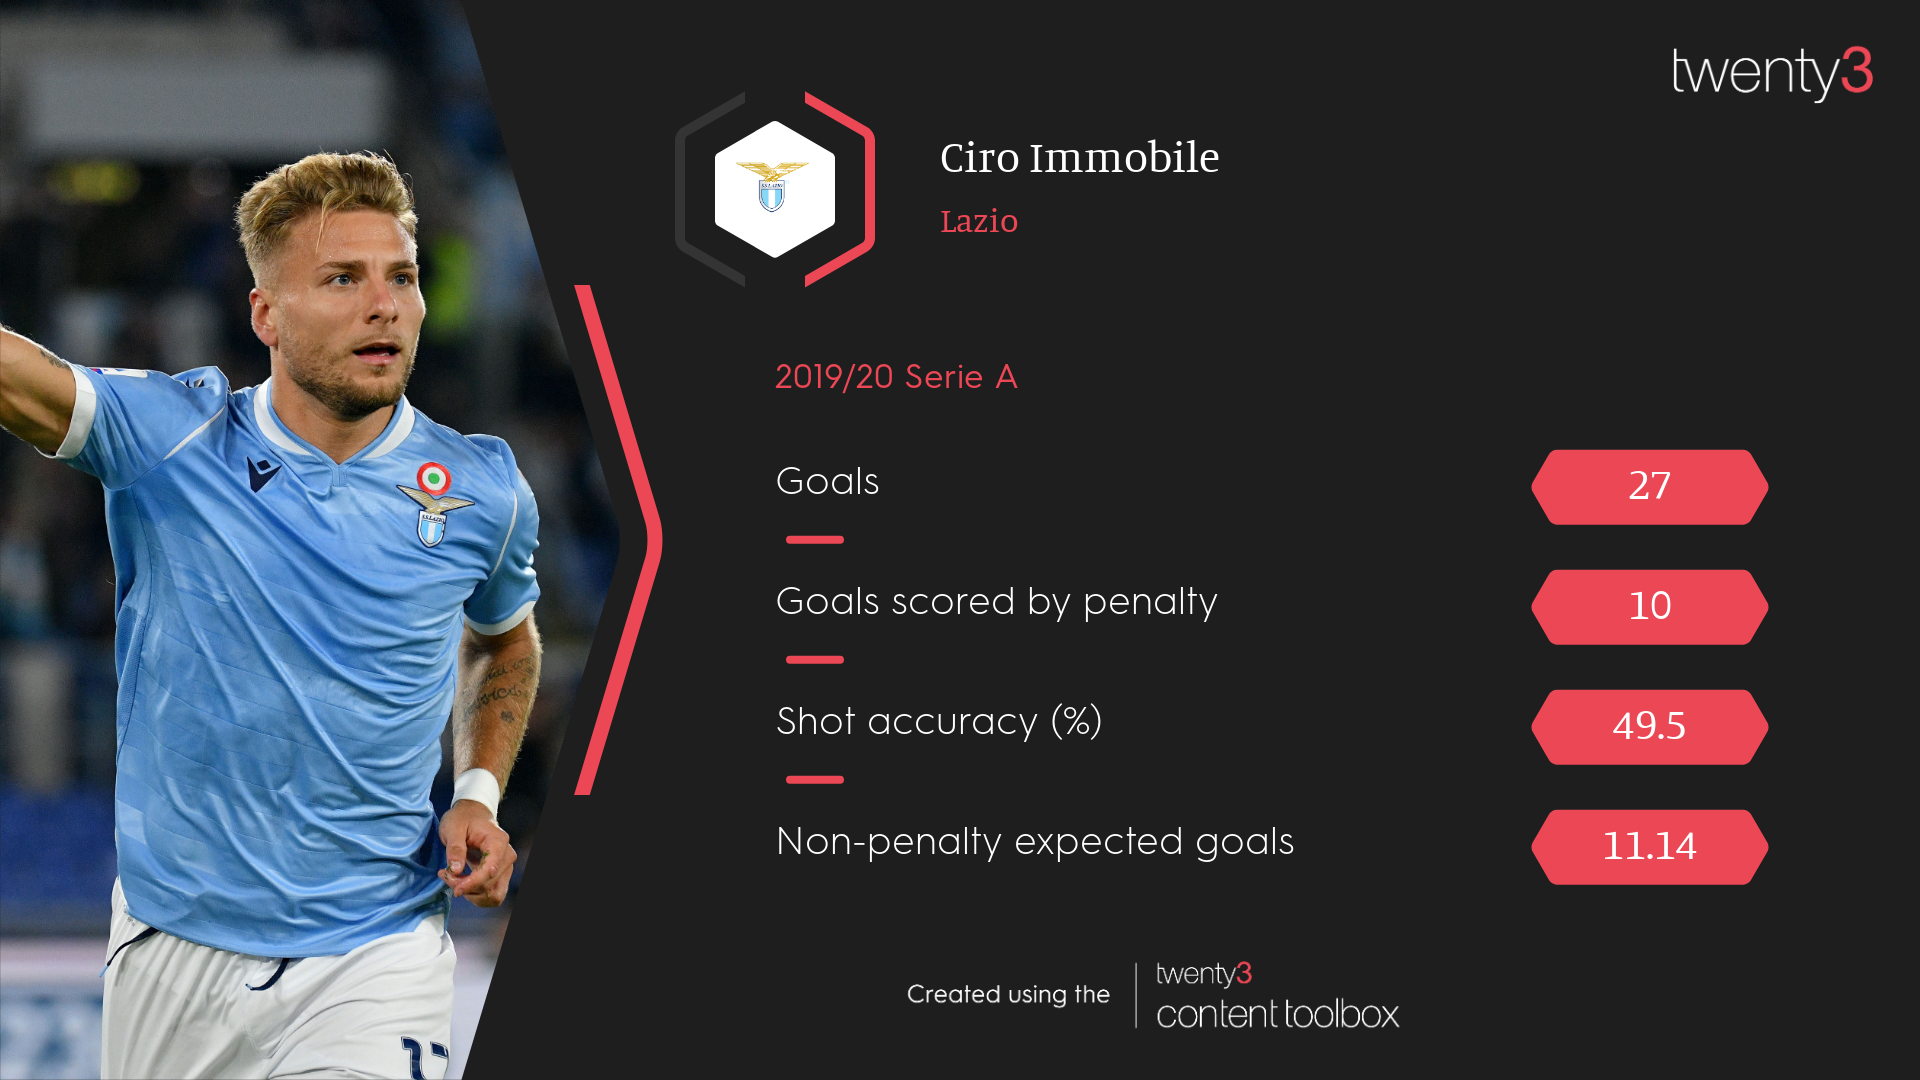
Non-penalty goals and open/set-play stats
Penalties are not a coin flip.
Despite the usual idea of a 50/50 situation, spot-kicks are converted around 76% of the time and, as such, are far easier chances than the vast majority of shots taken in football. The regular penalty-taker on a penalty-winning team will see their stats nicely boosted with these opportunities (which the taker might have had nothing to do with winning in the first place). Knocking them out of the tally and using ‘non-penalty’ goals/expected goals stats are something that’s quite commonplace.
Similarly, the corner and free-kick taker for a side can get a lot of shots and chances created just from set-pieces, and anyone expecting them to be that creative from open play might get an unpleasant shock. Separating open-play stats from set-play stats is, therefore, something that is sometimes done as well.
A lot of this can be boiled down to ‘context’. Is having a high number in this stat always good? Do good players always have a high number in this stat? Is there another reason why this particular player might have a very high or low number in a particular category? How valuable is this action on the pitch, and are all of them as valuable as each other? We know that shots and saves vary in quality, but passes, tackles, aerial duels will all vary in value to some extent as well.
But finally, we all have to draw the line of how much context we want to look for at some point. You don’t have to make your own expected goals model just to talk about shots, and you don’t have to become a football academic to talk about data. It’s just worthwhile keeping some of these things in the back of your mind.