
Keeping visualisations true to life

There’s a special kind of excitement about seeing visualisations you’ve helped create on the screen of Sky Sports. Ego, mostly, let’s be honest. But it’s also been really interesting to see which visualisations they choose to use.
At Twenty3, we have a whole toolbox of toys with various ways of displaying data. Heatmaps, shot maps, passing distribution sonars, passing networks, and there’s a few more exciting things in the pipeline too…
There was one type of visualisation that I hadn’t been won over by, though. Touch maps.
I’d, in my head, taken to referring to them as ‘chickenpox plots’ which isn’t exactly inaccurate but is definitely dataviz-snobbery on my part.

Yet touch maps have been far more popular than I would have expected prior to them being available to customers. And it’s interesting to think about why my original dismissal of them was wrong.
I’d previously thought that they were a little too simple. Heatmaps — which are the same data shown in a different way — seemed to me to be more flexible and more preferable. I felt like they focused the eye much more on key points of the pitch, and they certainly deal with large amounts of data better than a touch map.
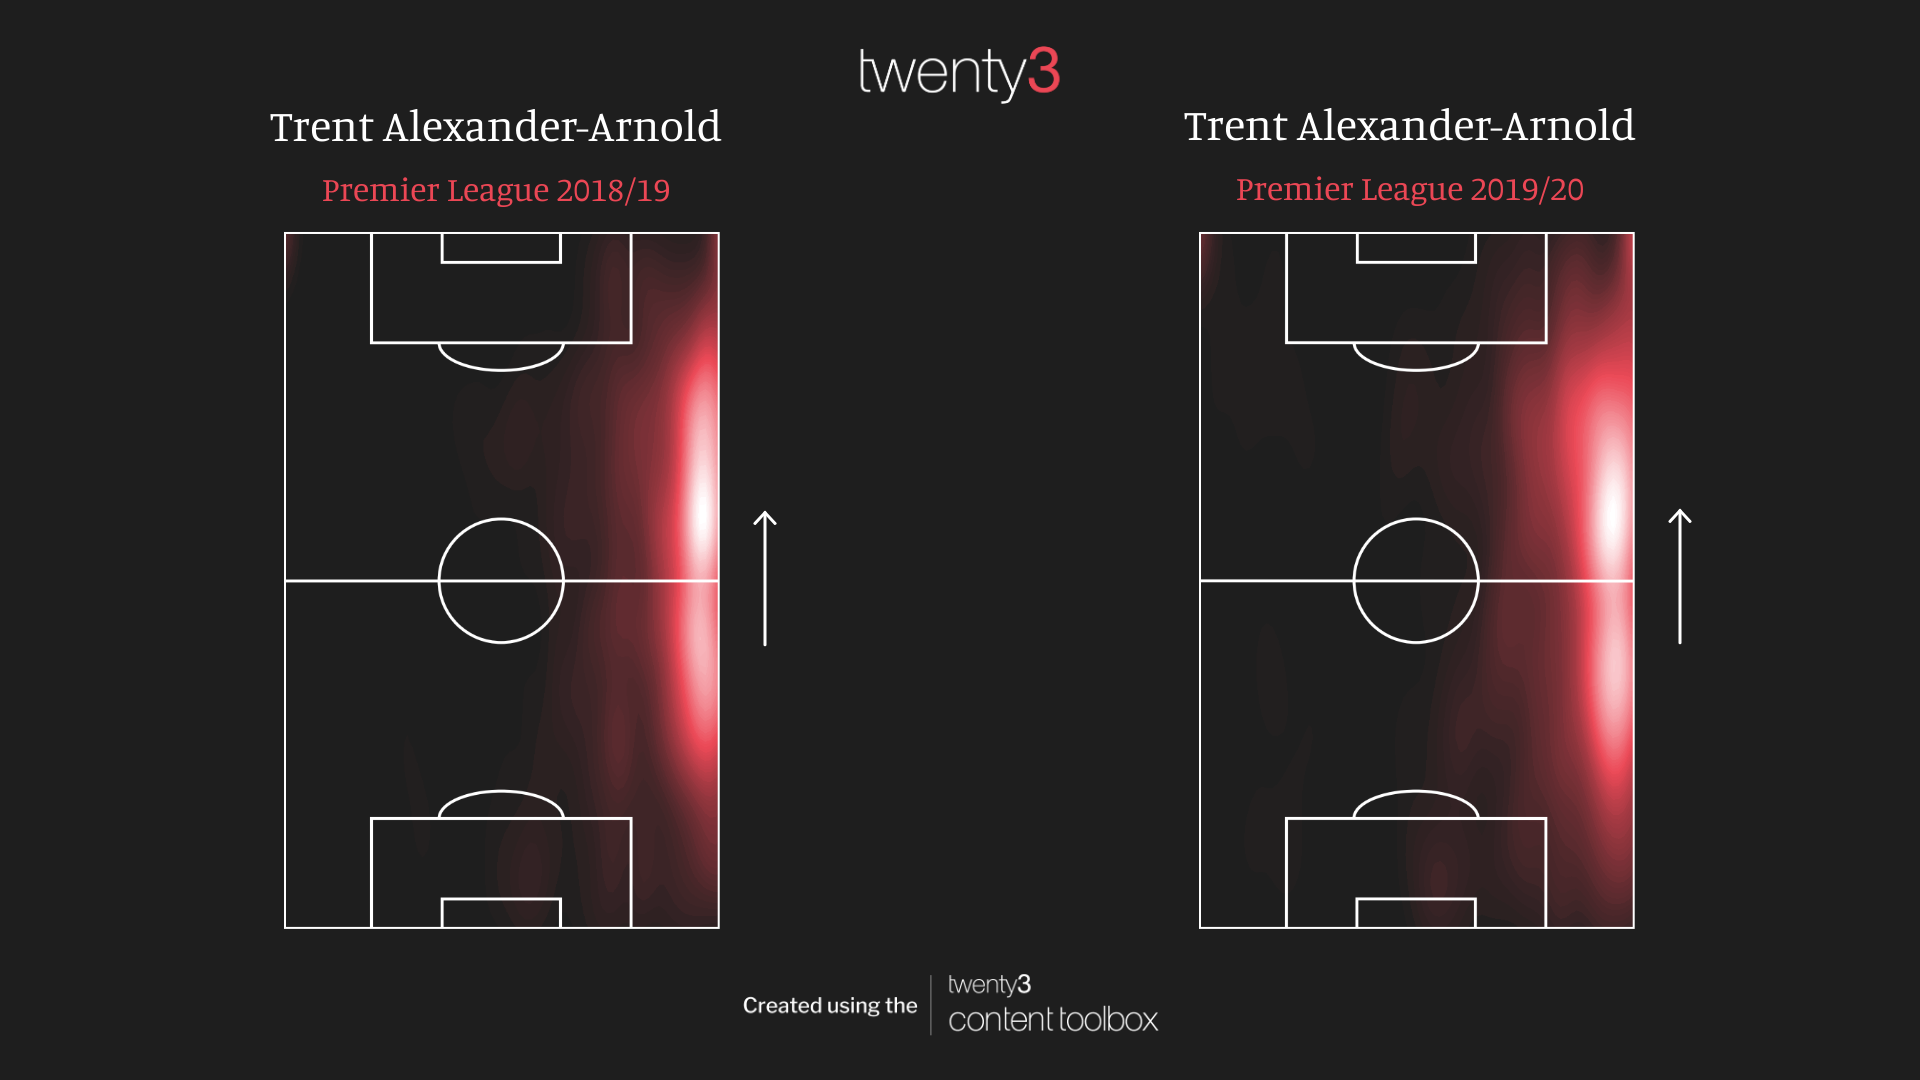
Example heatmaps showing Trent Alexander Arnold’s touch locations in 2018/19 and in 2019/20, suggesting a slight change of approach in the opposition half, with more touches further towards the centre of the pitch.
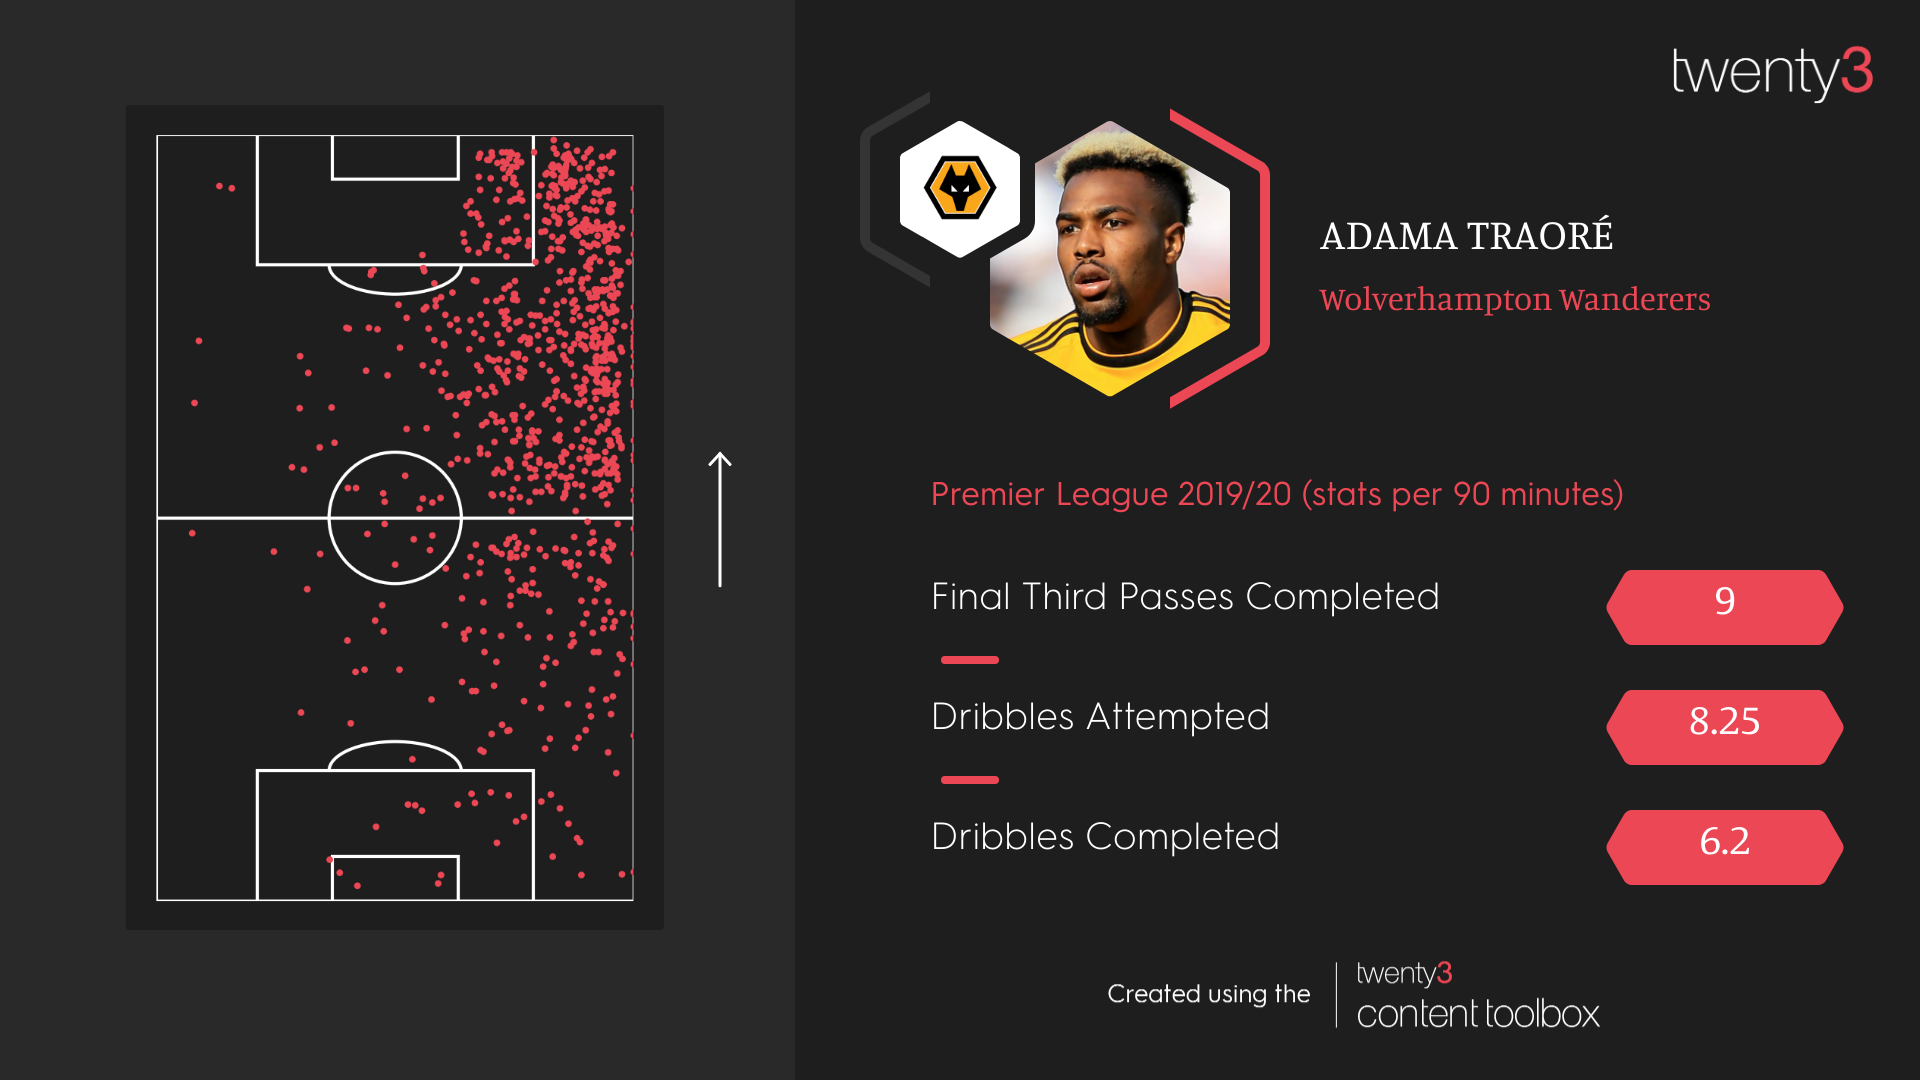
However, I think that a large part of why touch maps are popular is that they’re so tangible. Each point corresponds to an actual, real-life event on the pitch, and it’s easy to see those dots and imagine a player playing a pass or taking on an opponent or having a shot. Here’s the Adama Traoré one again that we saw earlier:
Heatmaps are useful but they’re abstract, and the player almost turns from a physical being into a conceptual one. There’s certainly a trade-off: touch maps can get too cluttered and then the pattern is only discernible through a heatmap’s abstraction. But I wonder where the balance lies and how data visualisation in general can take notice of this.
In football, visualising passing is something that’s going to bring a lot of difficulty, which makes abstraction a more likely avenue to go down. Touch maps are simple — each dot represents one action in the place on the pitch where it happened. There’s only one thing to worry about.
Passes, on the other hand, don’t just have one, don’t even just have two things of interest, but three or four: the start point, the end point, the relation between the two, and whether the pass was successful or not. To make visualising the data even more difficult, passes are the action that players make most often, so a true-to-life pass map gets cluttered, to the point of being unreadable, fast.
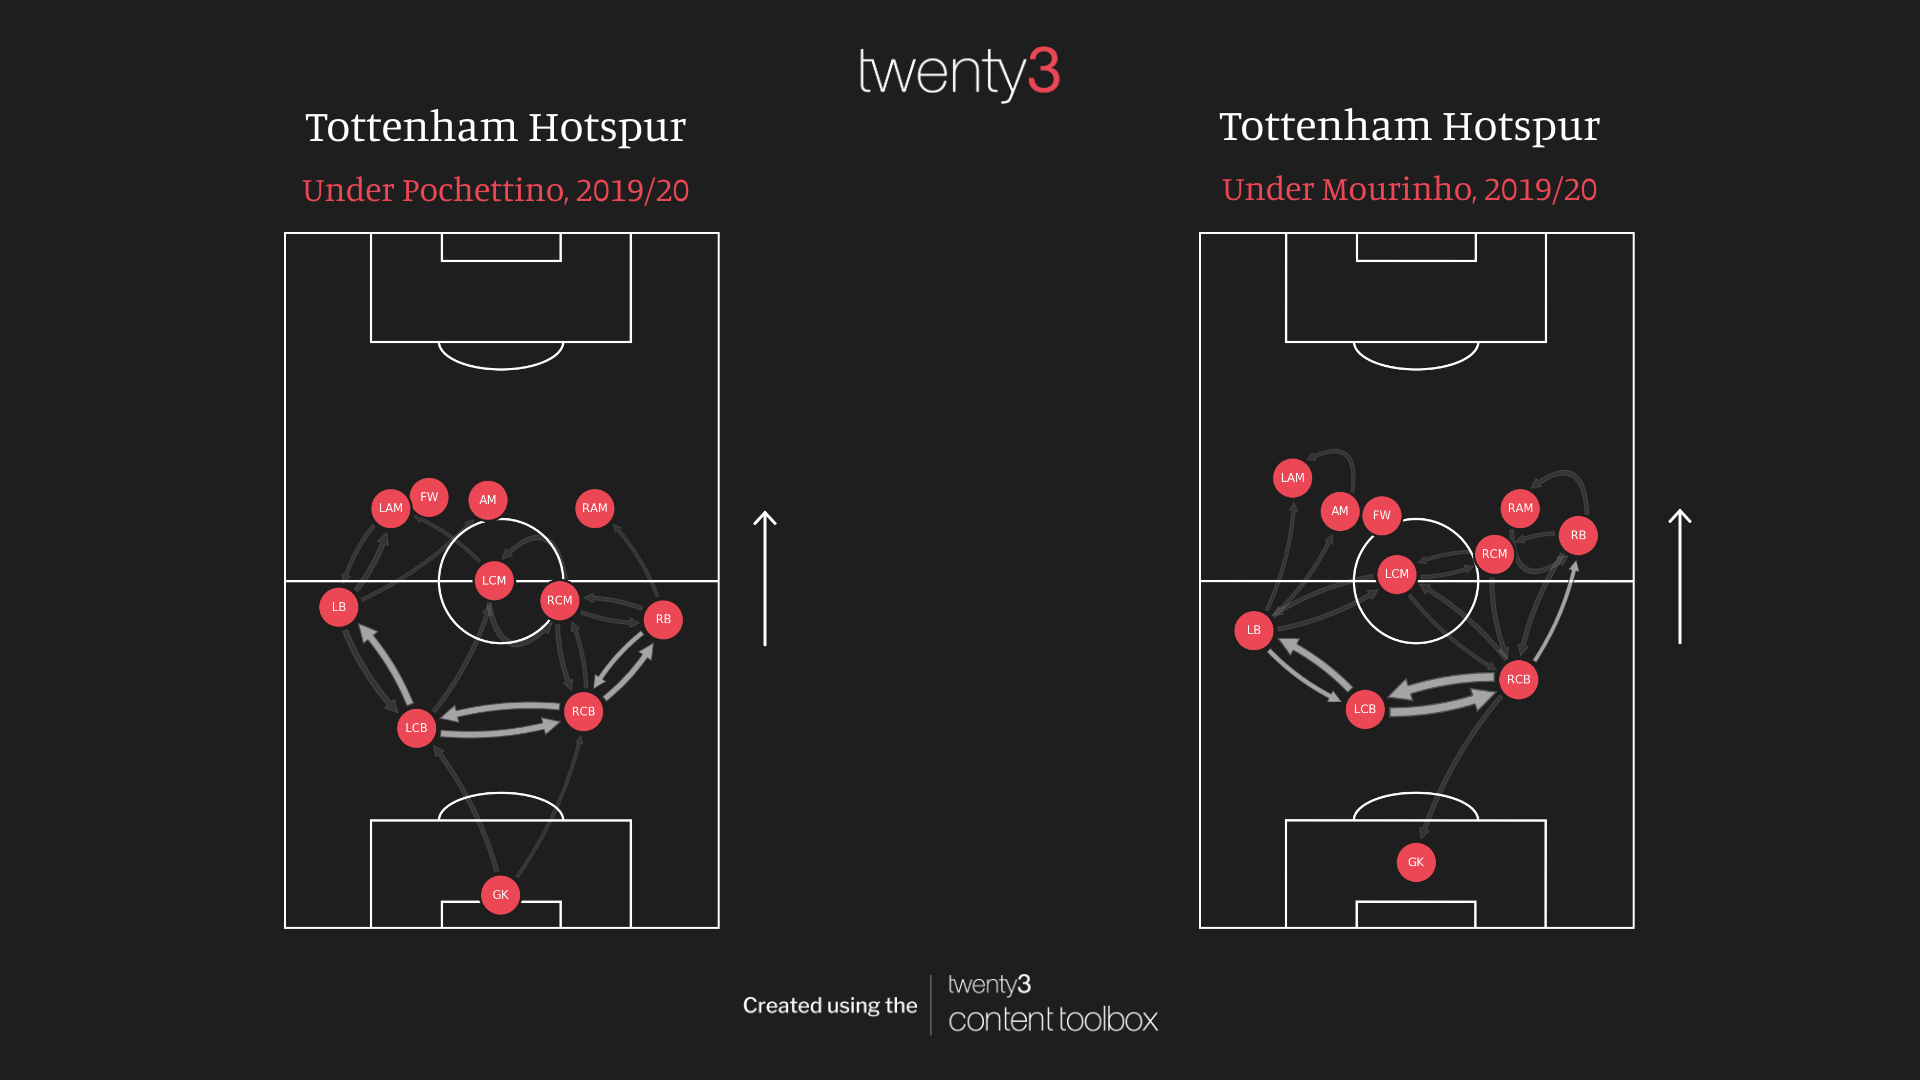
Perhaps the best way of visualising passing is to pick and choose which of these four factors you want to show. Probably the best passing-related visualisation that I know of is the ‘passing sonar’. StatsBomb — a source of inspiration for football data-users everywhere — has a good blog on the history of this viz type, and Twenty3’s version owes a debt in particular to Eliot McKinley’s work, but our streamlined version looks at two of the four possible variables related to passing.
The player is the centre-point, with each segment representing the proportion of their passes that are made in that direction in relation to them (so that’s relation between pass start and end point that we’re showing). Then we also show the amount of passes that were completed or unsuccessful.
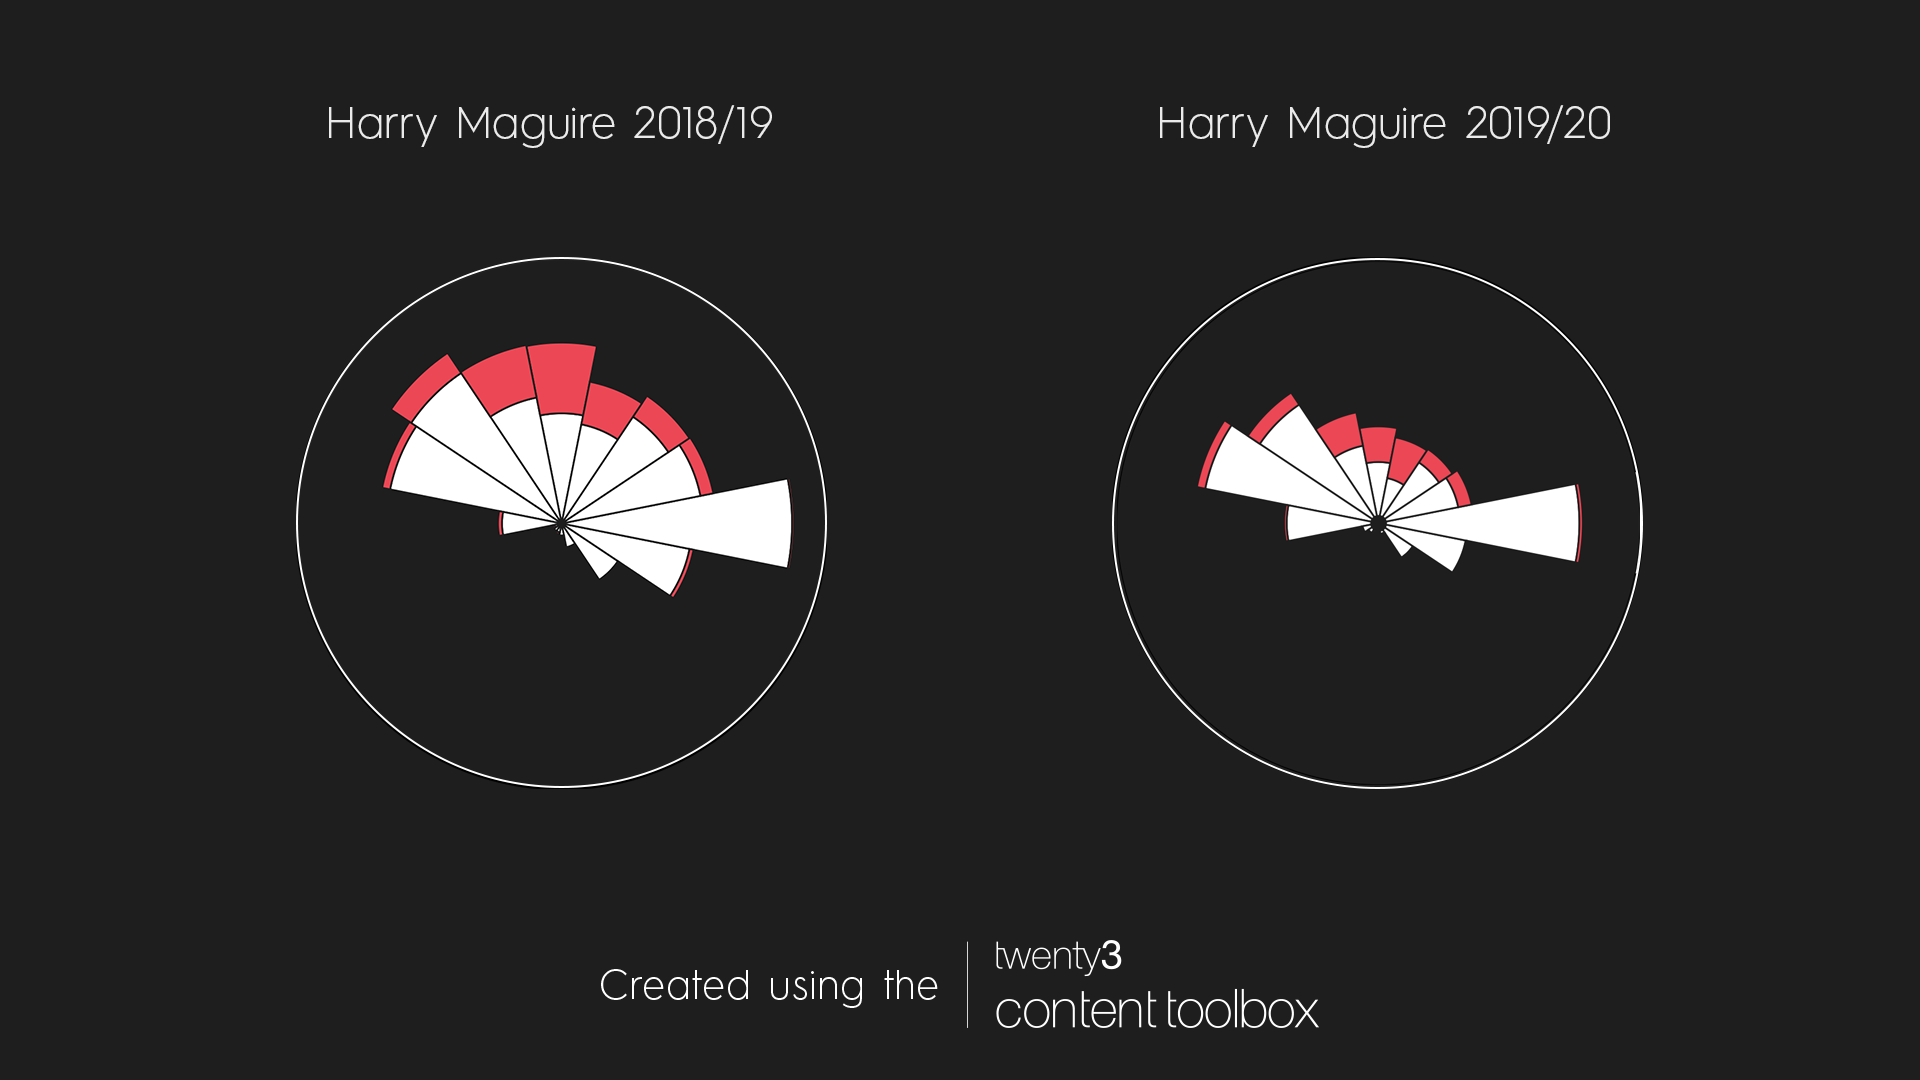
There are lots of variations on this theme, with some versions from other people using colour or shade to denote the average length of pass or average pass completion rate in that direction. In designing Twenty3’s version of the sonars, we decided to keep it simpler — which I personally think really helps make them easier to understand — and has the added bonus that they’re easier to produce in a customer’s own brand colours.
I think that our decision to show pass completion rate by having one block representing completed and another representing failed passes (rather than using shade as an indicator of pass completion rate) has a similar ‘grounding’ effect as touch maps have.
I think that it’s an extra level of abstraction to look at a segment on the sonar and imagine a 75% success rate vs seeing those two blocks of colour against each other. Maybe when we see the two blocks, as in our version, we’re able to imagine the passes more tangibly because it’s closer to the real-life passes. Players make a bunch and don’t make a smaller bunch of passes; they can’t 75% complete a pass.
It’s going to be interesting to keep innovating with football data visualisations. Let’s see how advanced we can get while keeping it as grounded-to-life as possible.